


Nossa equipe tem mais de 7,000,000 traders!
Todos os dias, trabalhamos juntos para melhorar a negociação. Obtivemos resultados elevados e avançamos.
O reconhecimento de milhões de traders em todo o mundo é a melhor apreciação do nosso trabalho! Você nos escolheu e faremos tudo o que for necessário para atender às suas expectativas!
Nós somos uma ótima equipe juntos!
InstaSpot. Orgulho de trabalhar para você!


Ator, hexacampeão do UFC e um verdadeiro herói!
Um homem de sucesso. Um homem que mostra o nosso caminho.
O segredo por trás do sucesso de Taktarov é um movimento constante em direção ao objetivo.
Revele todos os lados do seu talento!
Descubra, tente, falhe, mas nunca pare!
I InstaSpot. Sua história de sucesso começa aqui!
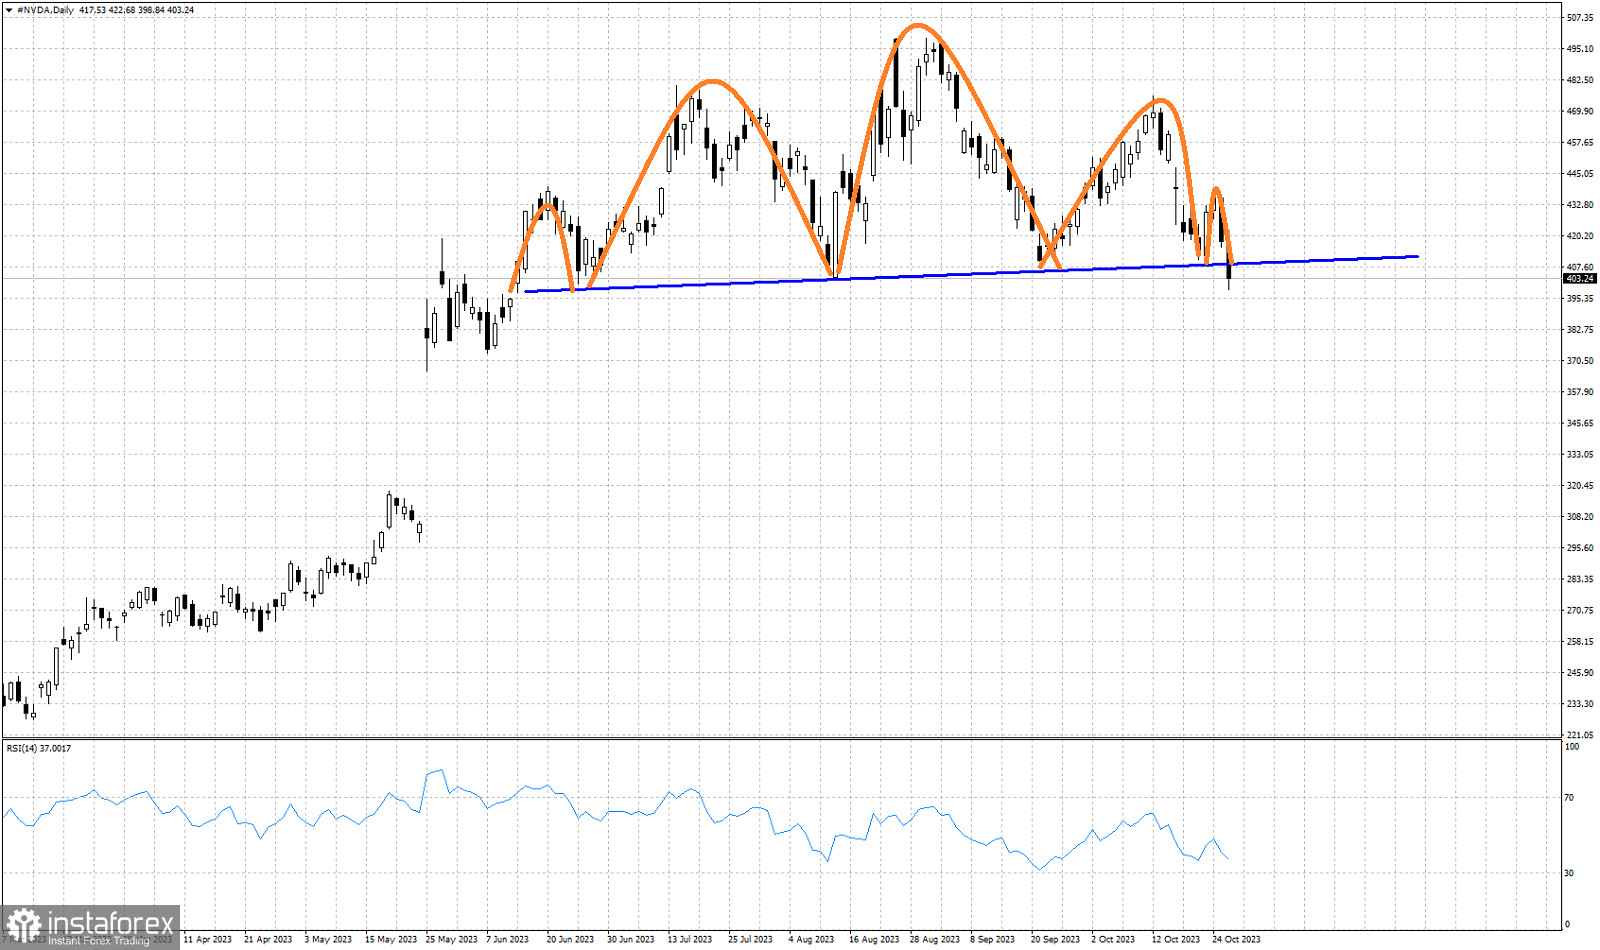
Blue line- neckline support
Orange lines- Head and shoulders pattern
NVDA stock price recently broke below the $407.50 price level pushing price to new 4 month lows. A bearish Head and Shoulders pattern has been activated in the NVDA chart as price has just broken below the neckline support. NVDA stock price is expected to be under selling pressures over the coming weeks. In order for this bearish scenario to get cancelled, we need to see price break above at least the $437 price level where the second right hand shoulder formed. Otherwise we should expect NVDA to fall towards the $320 price level.
*A análise de mercado aqui postada destina-se a aumentar o seu conhecimento, mas não dar instruções para fazer uma negociação.
InstaSpot analytical reviews will make you fully aware of market trends! Being an InstaSpot client, you are provided with a large number of free services for efficient trading.


