


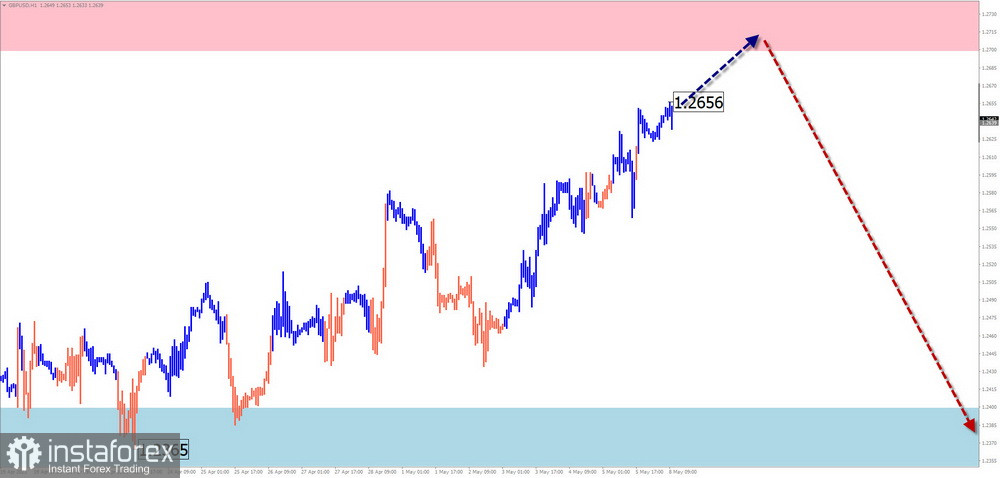
GBP/USD
Analysis:
The weekly scale chart of the British pound sterling shows that the pair's current wave is ascending. It starts counting from September of last year. The unfinished section in the main direction starts on March 9th. The price is approaching the lower boundary of the powerful potential reversal zone, but there are no signals of an imminent change of direction.
Forecast:
A general sideways trend in the British pound's price movement is expected in the upcoming week. In the coming days, expect the growth towards the calculated resistance zone. Later, there is a high probability of transitioning the movement with a further rollback of the price downward. By the end of the week, there should be the most volatility.
Potential reversal zones:
Resistance:
Support:
Recommendations:
Purchases: small lots within "intraday" can become profitable for the deposit.
Sales: until confirmed reversal signals appear in the resistance area, there are no conditions for such transactions.
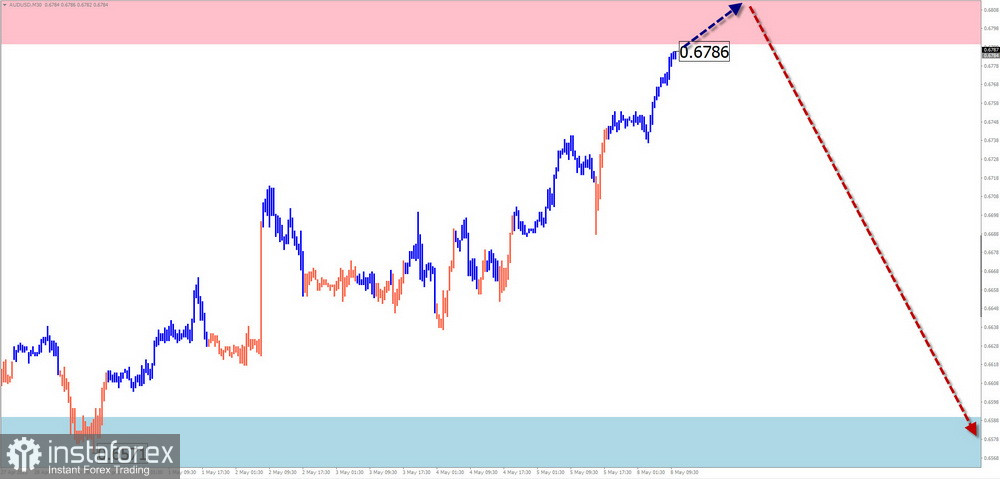
AUD/USD
Analysis:
In mid-October last year, an unfinished upward wave started on the Australian dollar chart. Since March, the price has been in a sideways drift, forming a complex correction. Quotes are squeezed in a narrow corridor between the powerful zones in the opposite direction of the senior TF.
Forecast:
In the first days of the upcoming week, a weakly ascending movement vector is more likely. At the upper boundary of the price corridor, a "sideways" movement can be expected. By the end of the week, expect increased activity, reversal, and resumption of the downward movement trend.
Potential reversal zones:
Resistance:
Support:
Recommendations:
Purchases: high risk, may be unprofitable.
Sales: after confirmed reversal signals appear in the resistance area, they have the potential for conducting trading transactions.
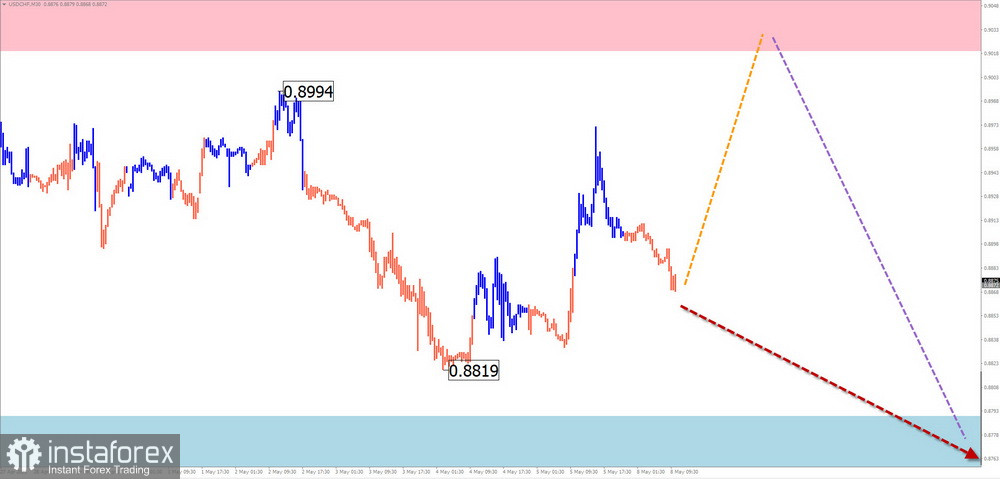
USD/CHF
Analysis:
The downward wave of the Swiss franc major that started in March last year has entered its final phase. The price has approached the upper boundary of the powerful potential reversal zone. The wave structure appears complete at the time of analysis. No imminent reversal signals have formed on the chart.
Forecast:
In the coming days, there is a high probability that the bearish price movement will transition into a sideways plane. A brief upward rollback is possible in the coming days. Increased activity and a resumption of the price decline are more likely towards the end of the week.
Potential reversal zones:
Resistance:
Support:
Recommendations:
Sales: have low potential. Limiting the duration of transactions within trading sessions and reducing the lot size is safer.
Purchases: transactions are unpromising until confirmed reversal signals appear in the support zone according to your TF.
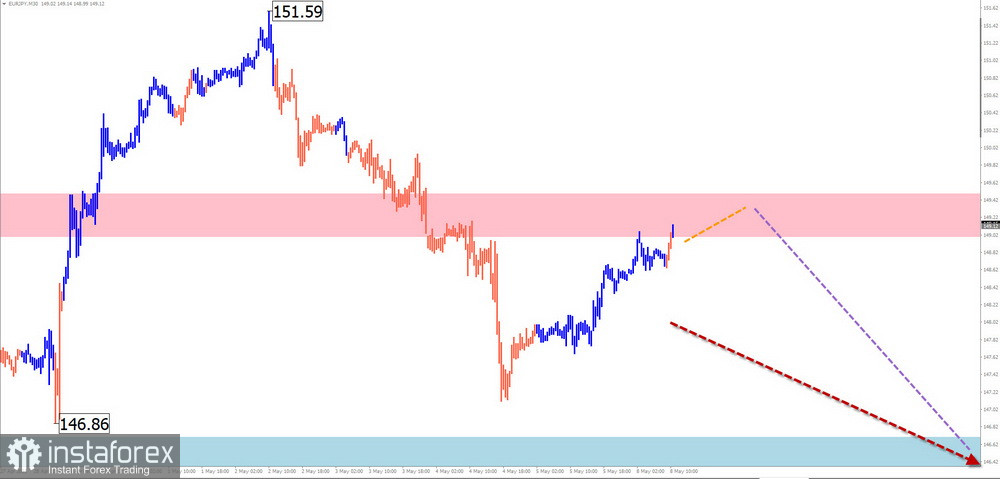
EUR/JPY
Analysis:
The current wave structure for the EUR/JPY pair can be considered the bullish wave that started at the end of March. Since the beginning of May, the price has been forming a correction from the powerful resistance zone on the weekly TF. The structure of this wave is not complete at the time of analysis.
Forecast:
The upcoming week is expected to see the price move within the boundaries of the formed price corridor. At the beginning of the week, a sideways movement along the resistance zone is more likely. A change in direction is expected on Wednesday or Thursday. A breakthrough beyond the zones designated by the channel is unlikely in the upcoming week.
Potential reversal zones:
Resistance:
Support:
Recommendations:
Sales: may become profitable after a confirmed reversal in the resistance area.
Purchases: have low potential and may lead to losses.
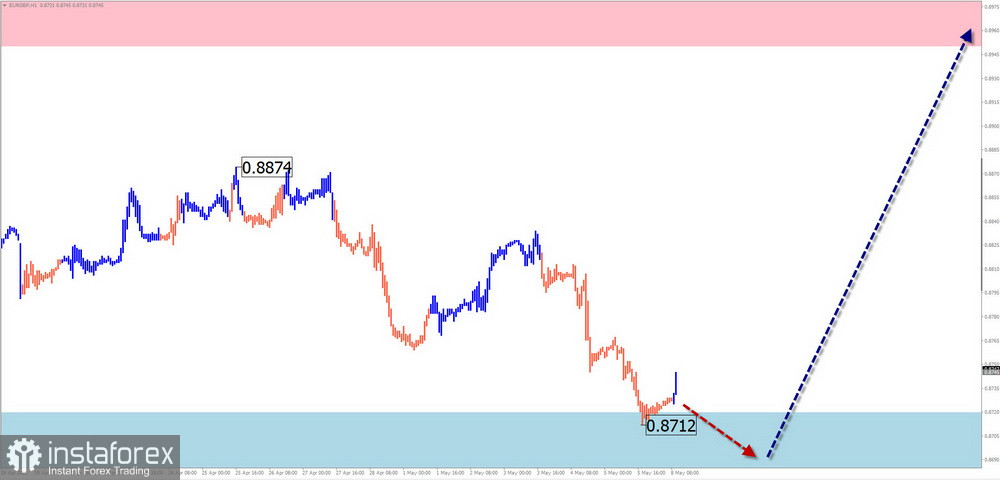
EUR/GBP
Analysis:
Since September last year, the EUR/GBP pair has continued to form a downward wave. At the beginning of this year, the price moved into a sideways drift, forming the middle part (B) on the chart. The structure of this wave segment does not show completion. The currency pair is located at the lower boundary of the price corridor formed over the last six months.
Forecast:
In the coming days, a sideways movement within the boundaries of the calculated support can be expected. An increase in volatility, a reversal, and a resumption of price growth are expected afterward.
Potential reversal zones:
Resistance:
Support:
Recommendations:
Sales: there are no conditions for such transactions.
Purchases: can be used in trading after confirmed reversal signals appear in the support area according to your TF.
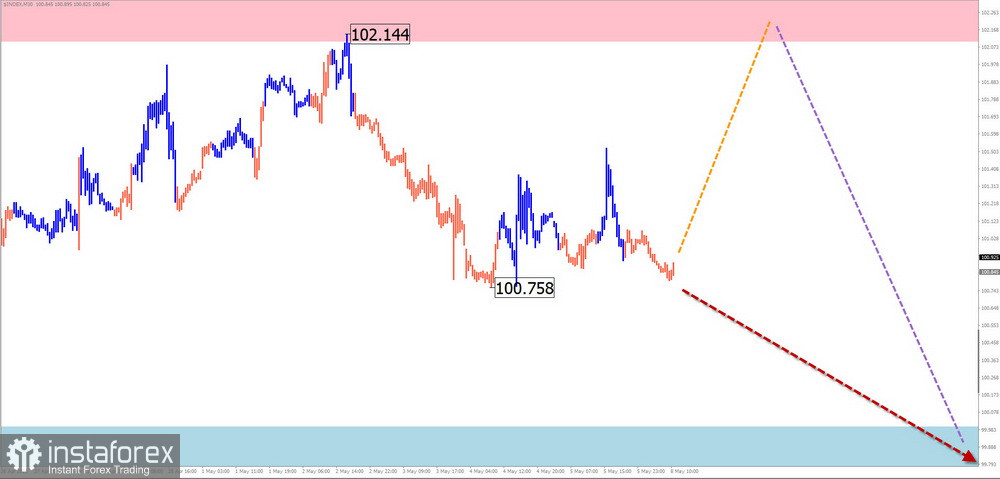
US Dollar Index
Analysis:
Since September last year, the position of the US dollar relative to other currencies has been steadily weakening. The quotes have reached the zone of the upper boundary of the potential reversal area on the monthly TF. The wave structure appears complete at the time of analysis, but there are no signs of a quick reversal on the chart.
Forecast:
In the upcoming week, the most likely scenario is the continued movement of the dollar's quotes, primarily in a sideways plane. A pullback to the resistance zone can be expected in the coming days. A halt will follow this in growth, a reversal, and a resumption of the decline.
Potential reversal zones:
Resistance:
Support:
Recommendations:
A halt in the weakening of the US dollar and the rise of its exchange rate can give a short-term boost to the decline of national currencies in the major pairs. It should be noted that this is a temporary trend.
Explanations: In simplified wave analysis (SWA), all waves consist of 3 parts (A-B-C). The last incomplete wave is analyzed on each TF. Dotted lines show expected movements.
Attention: The wave algorithm does not consider the duration of instrument movements over time!
*A análise de mercado aqui postada destina-se a aumentar o seu conhecimento, mas não dar instruções para fazer uma negociação.
InstaSpot analytical reviews will make you fully aware of market trends! Being an InstaSpot client, you are provided with a large number of free services for efficient trading.


