


Nossa equipe tem mais de 7,000,000 traders!
Todos os dias, trabalhamos juntos para melhorar a negociação. Obtivemos resultados elevados e avançamos.
O reconhecimento de milhões de traders em todo o mundo é a melhor apreciação do nosso trabalho! Você nos escolheu e faremos tudo o que for necessário para atender às suas expectativas!
Nós somos uma ótima equipe juntos!
InstaSpot. Orgulho de trabalhar para você!


Ator, hexacampeão do UFC e um verdadeiro herói!
Um homem de sucesso. Um homem que mostra o nosso caminho.
O segredo por trás do sucesso de Taktarov é um movimento constante em direção ao objetivo.
Revele todos os lados do seu talento!
Descubra, tente, falhe, mas nunca pare!
I InstaSpot. Sua história de sucesso começa aqui!
Data on the UK labor market came out without any fundamental changes. Unemployment in the country remained at 3.6%. Employment increased by 27,000, while jobless claims rose by 19,700.
In fact, the indicators coincided with expectations; there is no reaction on the market.
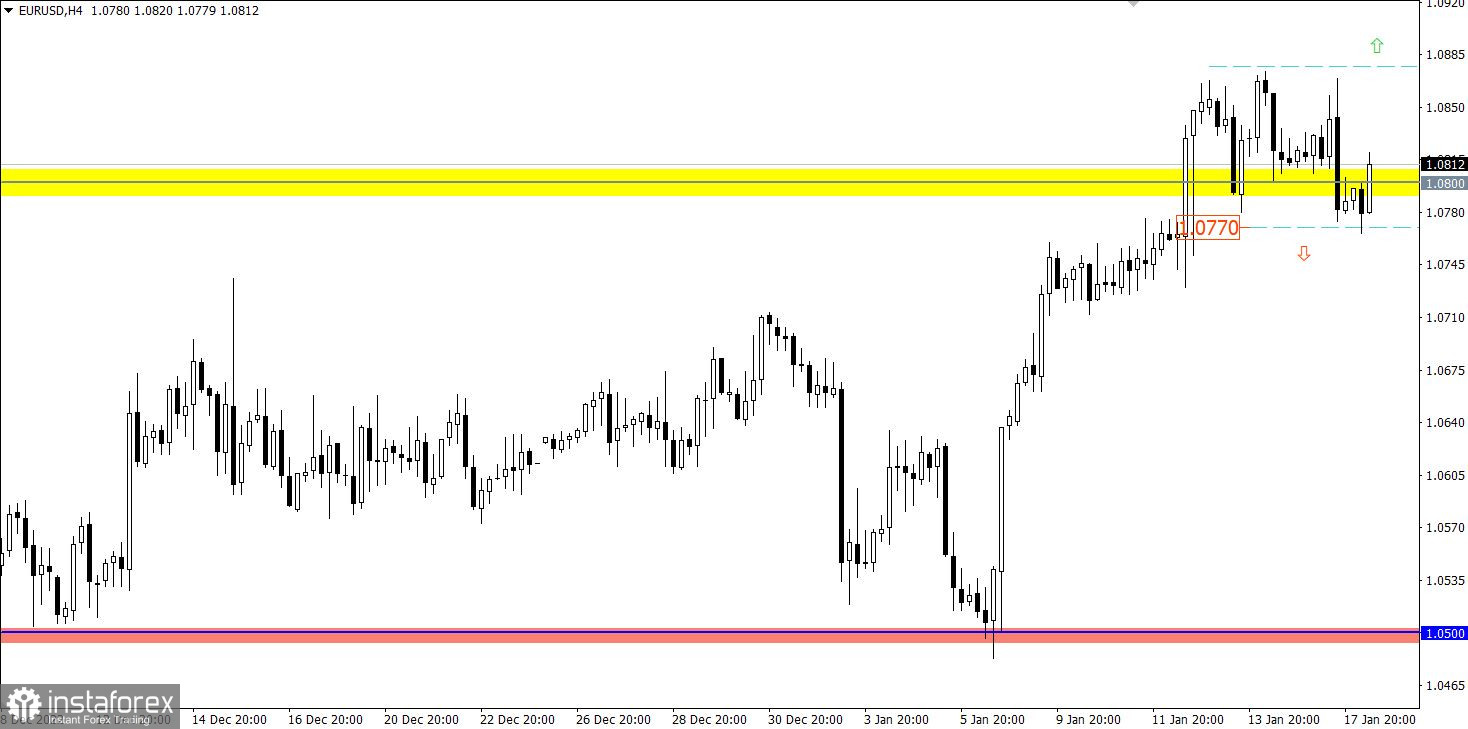
EURUSD went below the level of 1.0800 during the variable turbulence, which indicated traders' local interest in short positions. Despite the existing price changes, no cardinal changes were observed in the period of the past day.
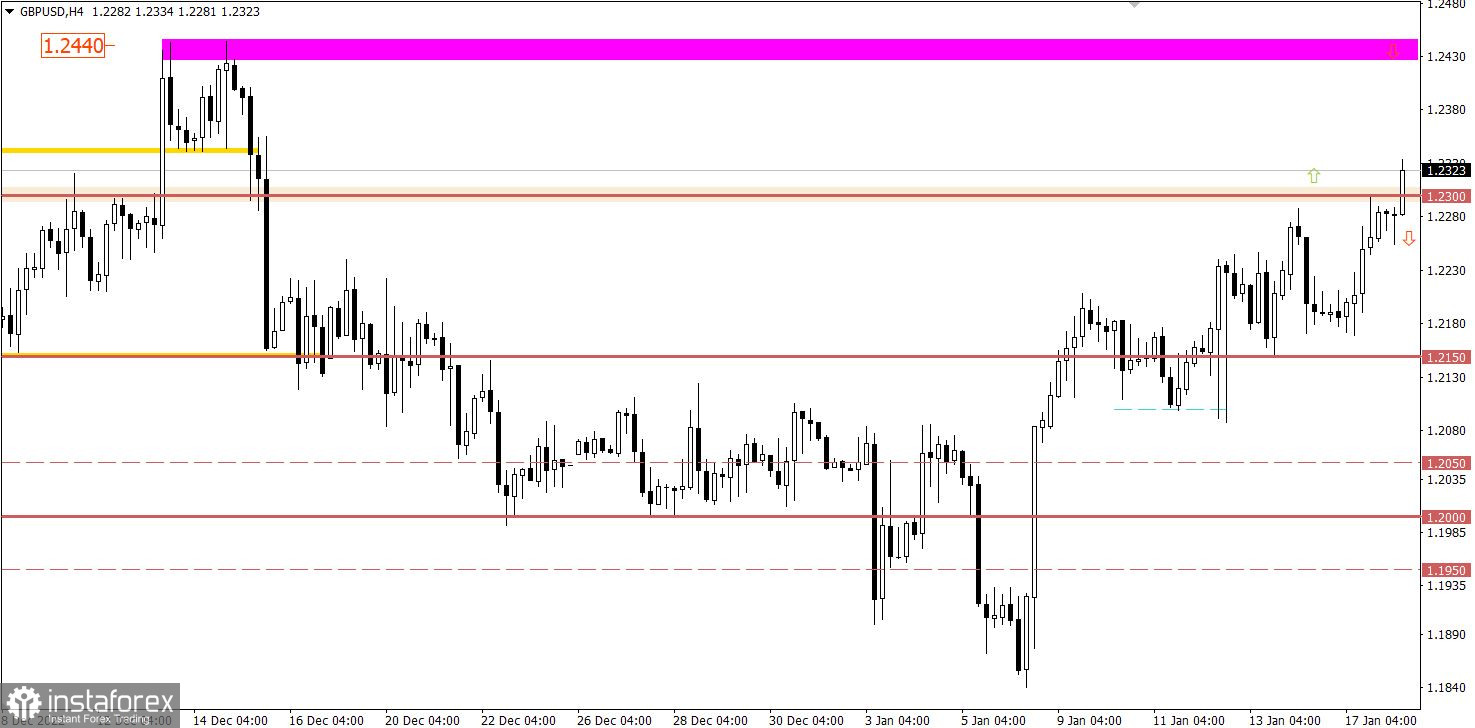
GBPUSD showed a negative correlation with EURUSD on the market, which is not typical for these two trading instruments. The upward cycle was not only preserved, it was prolonged. Buyers broke through the 1.2300 resistance level, which indicates a high demand for long positions in the pound sterling.
Today is the most news-packed trading day. Since the opening of European markets, data on inflation in the UK have been published. The consumer price index shows a slowdown from 10.7% to 10.5%. Despite the positive dynamics, inflation is still at a high level. However, the decline in inflation is pushing the Bank of England to revise the current program to tighten monetary policy. This means that the pace of interest rate hike will slow down or stop rising altogether.
The main driver for speculators may be inflation data in the eurozone, where, based on forecasts, the consumer price index may fall from 10.1% to 9.2%. Positive dynamics in inflation indicates that the ECB will be more loyal to the statements regarding the increase in interest rates. This, in turn, may put pressure on the euro.
The publication of retail sales data in the United States is expected during the American trading session. Retail sales growth is expected to fall from 6.5% to 5.0%. The growth rates of industrial production may slow down from 2.5% to 1.8%.
These are not the best figures, thus the U.S. dollar may be under pressure if the data is confirmed.
Time targeting
EU Inflation – 10:00 UTC
U.S. Retail Sales – 13:30 UTC
U.S. Industrial production – 14:15 UTC
Although the price managed to hold below the level of 1.0800, there is no clear technical signal of the end of the sideways formation. Thus, it is worth waiting for the price to hold below 1.0770 for at least a four-hour period to ascertain the intentions of the sellers.
Until then, the turbulence within the boundaries of 1.0800/1.0870 will remain on the market.
A stable hold of the price above the level of 1.2300 allows for further growth, which may eventually lead to an update of the December high.
As for the downside scenario, it will definitely be considered under a number of technical circumstances: the return of the price below 1.2300 in the daily period or in the case of a rebound from the area of the December local high at 1.2440.
The candlestick chart type is white and black graphic rectangles with lines above and below. With a detailed analysis of each individual candle, you can see its characteristics relative to a particular time frame: opening price, closing price, intraday high and low.
Horizontal levels are price coordinates, relative to which a price may stop or reverse its trajectory. In the market, these levels are called support and resistance.
Circles and rectangles are highlighted examples where the price reversed in history. This color highlighting indicates horizontal lines that may put pressure on the asset's price in the future.
The up/down arrows are landmarks of the possible price direction in the future.
*A análise de mercado aqui postada destina-se a aumentar o seu conhecimento, mas não dar instruções para fazer uma negociação.
InstaSpot analytical reviews will make you fully aware of market trends! Being an InstaSpot client, you are provided with a large number of free services for efficient trading.


