


A lenda da equipe InstaSpot!
Lenda! Você acha que isso é retórica bombástica? Mas como devemos chamar um homem que se tornou o primeiro asiático a vencer o campeonato mundial de xadrez aos 18 anos e que se tornou o primeiro grande mestre indiano aos 19? Esse foi o começo de um caminho difícil para o título de campeão do mundo para Viswanathan Anand, o homem que se tornou parte da história do xadrez para sempre. Agora mais uma lenda na equipe InstaSpot!


O Borussia é um dos clubes de futebol com mais títulos da Alemanha, que provou repetidamente aos fãs: o espírito de competição e liderança certamente levará ao sucesso. Negocie da mesma maneira que os profissionais do esporte jogam: com confiança e ativamente. Mantenha o "ritmo" do Borussia FC e esteja na liderança com a InstaSpot!
The EU's final inflation data coincided with the preliminary estimate, which showed an increase in consumer prices from 4.9% to 5.0%. These data did not come out as a surprise to traders, and in fact, they were already considered in the price.
During the US trading session, weekly data on applications for unemployment benefits in the United States was published, where they recorded a noticeable increase.
Statistics details:
The volume of initial applications for benefits increased from 231 thousand to 286 thousand.
The volume of repeated applications for benefits increased from 1,551 thousand to 1,635 thousand.
Statistics on the US labor market are not positive, so the US dollar's reaction was appropriate – a sell-off.
Analysis of trading charts from January 20:
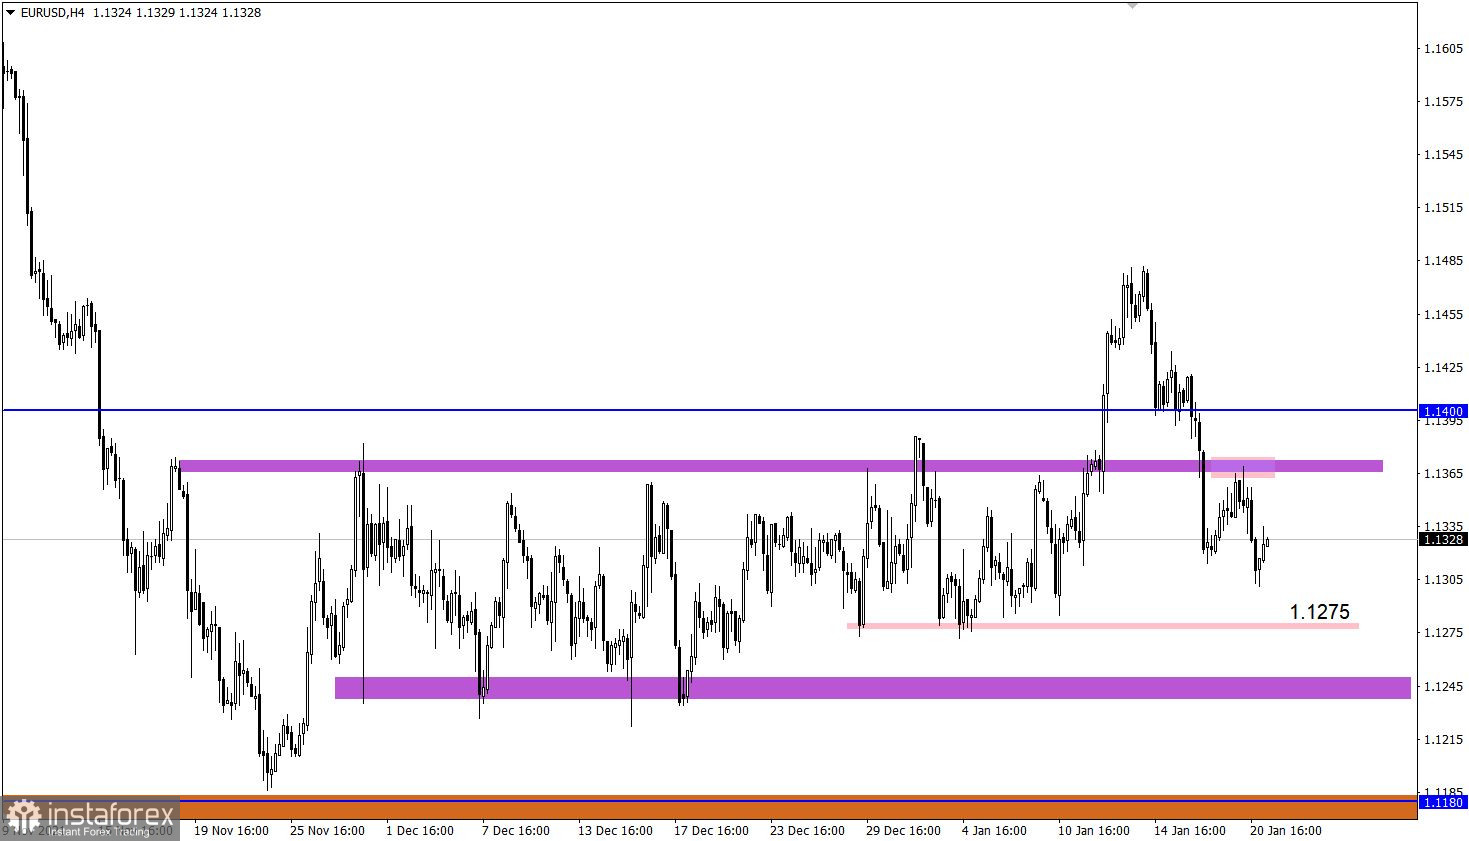
The EUR/USD pair reached the upper border of the side channel 1.1230/1.1370 during a short pullback from the support level of 1.1315. This led to a reduction in the volume of long positions and, as a result, to a price rebound along a downward course. Based on market cycles, the euro exchange rate is gradually weakening, which may signal the end of the correction cycle from December 2021.
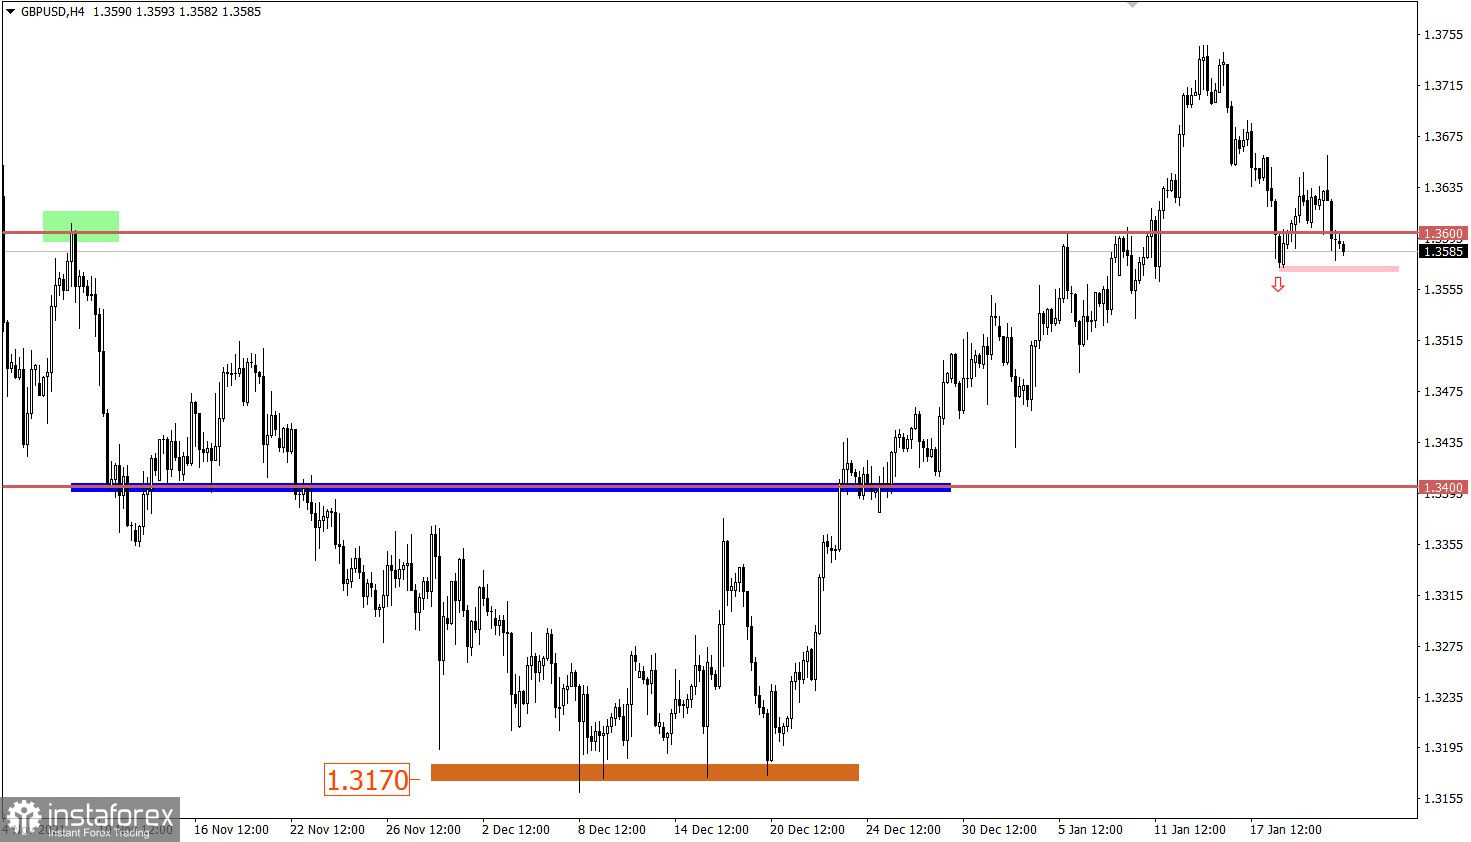
The stagnation of the GBP/USD pair along the level of 1.3600 was completed by speculative surges, which led to the decline of the rate below the level of 1.3580. This indicates a high interest in short positions among market participants, which may lead to the pound's subsequent weakening.
Therefore, the upward cycle of December 20 last year may be broken, which will lead to a gradual restoration of downward interest in the market if a number of technical conditions coincide.
January 21 economic calendar:
The retail sales data in the UK were published today, where their volume fell by 3.7% on a monthly basis, which is a lot. As a result, the annual indicator changed from growth to decline, that is, to -0.9%.
The UK data is very bad, but the pound has not yet reacted. Perhaps, there will be a gradual weakening later.
Trading plan for EUR/USD on January 21:
There is still a downward interest in the market. To strengthen it, the quote needs to stay below the level of 1.1295. This step will lead to a subsequent weakening of the euro towards the lower border of the side channel 1.1230. A temporary stop in the direction of sellers is possible in the area of 1.1275.
Trading plan for GBP/USD on January 21:
In this situation, the control signal to sell will appear in the market when the price is kept below the local low (1.3572) on January 18. This step will lead to an increase in the volume of short positions, which will lead to a weakening of the pound towards the range of 1.3500-1.3400. Only the US dollar's gradual recovery can change the current upward cycle.
What is reflected in the trading charts?
A candlestick chart view is graphical rectangles of white and black light, with sticks on top and bottom. When analyzing each candle in detail, you will see its characteristics of a relative period: the opening price, closing price, and maximum and minimum prices.
Horizontal levels are price coordinates, relative to which a stop or a price reversal may occur. These levels are called support and resistance in the market.
Circles and rectangles are highlighted examples where the price of the story unfolded. This color selection indicates horizontal lines that may put pressure on the quote in the future.
The up/down arrows are the reference points of the possible price direction in the future.
*A análise de mercado aqui postada destina-se a aumentar o seu conhecimento, mas não dar instruções para fazer uma negociação.
InstaSpot analytical reviews will make you fully aware of market trends! Being an InstaSpot client, you are provided with a large number of free services for efficient trading.


