


Nossa equipe tem mais de 7,000,000 traders!
Todos os dias, trabalhamos juntos para melhorar a negociação. Obtivemos resultados elevados e avançamos.
O reconhecimento de milhões de traders em todo o mundo é a melhor apreciação do nosso trabalho! Você nos escolheu e faremos tudo o que for necessário para atender às suas expectativas!
Nós somos uma ótima equipe juntos!
InstaSpot. Orgulho de trabalhar para você!


Ator, hexacampeão do UFC e um verdadeiro herói!
Um homem de sucesso. Um homem que mostra o nosso caminho.
O segredo por trás do sucesso de Taktarov é um movimento constante em direção ao objetivo.
Revele todos os lados do seu talento!
Descubra, tente, falhe, mas nunca pare!
I InstaSpot. Sua história de sucesso começa aqui!
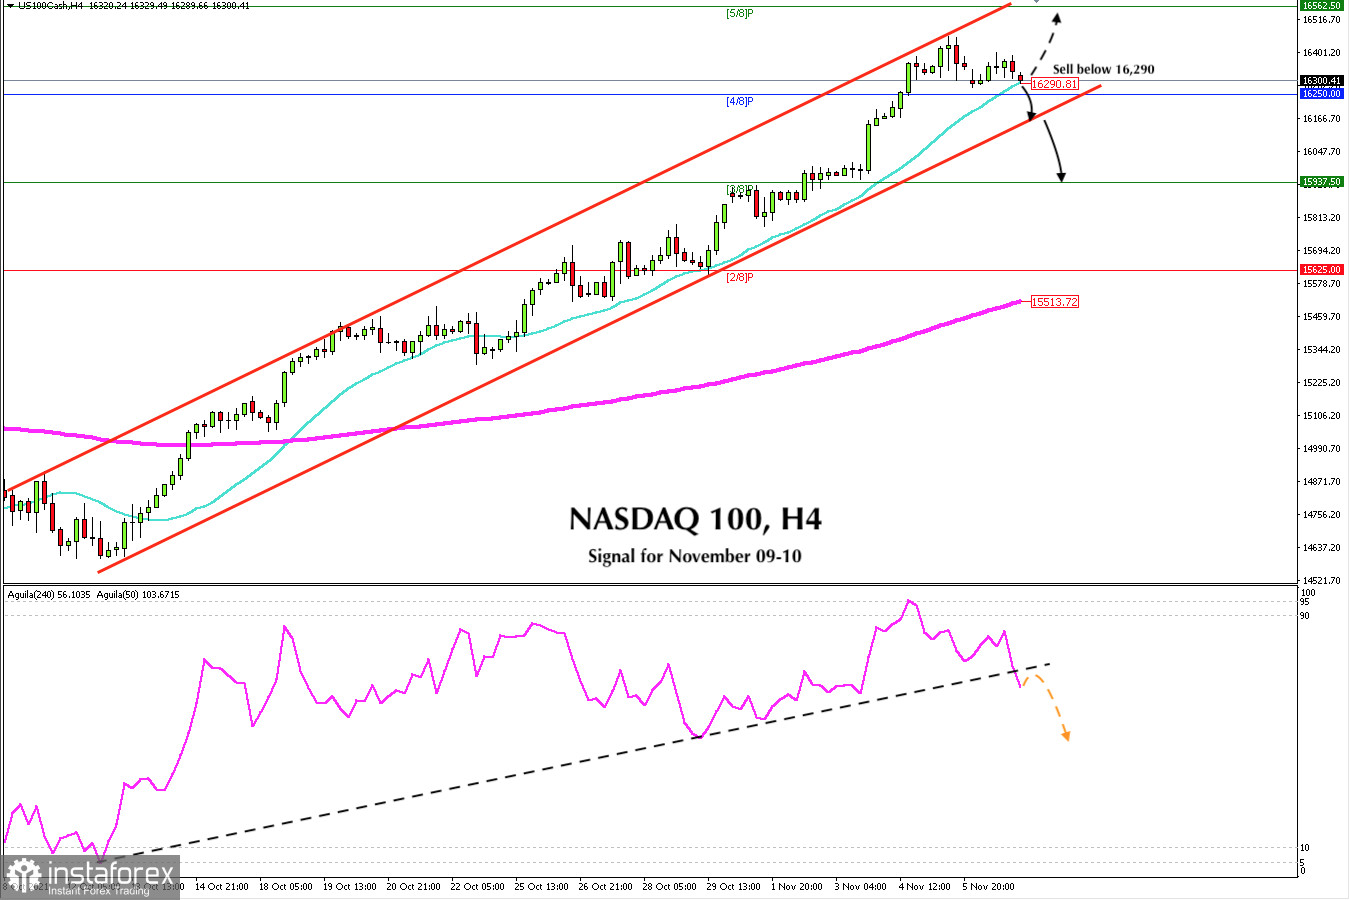
The Nasdaq 100 (#NDX) registered an all-time high at 16,454 on May 4 after having touched the top in the uptrend channel. It initiated a technical correction due to overbought conditions and now it is located at 16,300, just above the line of 21. If it consolidates below this level in the next few hours, a bearish movement could occur to the bottom of the channel around 16,150. At this point, a technical rebound could occur and resume its main movement.
At the beginning of the week, the Nasdaq 100 opened with a gap. Then during the American session, it managed to cover this gap and now it is falling again. This could be a negative sign for this technological index, and it is likely that investors will liquidate their orders as part of profit taking, and a sustained decline could occur in the next few days.
If it manages to stay above the 21 moving average in the next few hours and consolidates above this zone, we could expect a bullish move to 5/8 of a murray around 16,562.
One factor that is weakening the strength of this index and increasing downward pressure is that the United States passed a bipartisan infrastructure bill. Meanwhile, US Treasury yields are rising, and global indices swing between gains and losses. A sharp break in the uptrend channel could accelerate the decline of the Nasdaq in the next few days.
The Nasdaq 100 began an uptrend on October 12 and so far it continues to oscillate within this trending channel formed on the 4-hour chart. In the chart above we can see that the Nasdaq 100 is approaching the bottom of the bullish channel. If it breaks through this support, it will be the beginning of a new bearish scenario, and we could see a fall to 3/8 of murray around 15,937.
On November 4, the eagle indicator reached the extreme overbought zone at 95 points. From this level, the Nasdaq index started a technical correction. At the moment, the indicator continues to give a bearish signal. We should wait for confirmation only if it consolidates below the SMA of 21. A sharp breakout of the uptrend channel would lead to a drop towards the 200 EMA located at 15,513.
Our forecast for the next few hours is to sell below 16,290 (21 SMA) with targets towards 16,150. This is the line of the uptrend channel. If this support is broken, we could continue to sell until 3/8 murray around 15,937 and with a final target at the 200 EMA around 15,500.
Support and Resistance Levels for November 09 - 10, 2021
Resistance (3) 16,461
Resistance (2) 16,396
Resistance (1) 16,335
----------------------------
Support (1) 16,270
Support (2) 13,210
Support (3) 16,145
***********************************************************
A trading tip for Nasdaq 100 for November 09 - 10, 2021
Sell below 16,290 (SMA 21) with take profit at 16,150 and 15,937 (3/8), stop loss above 16,350.
*A análise de mercado aqui postada destina-se a aumentar o seu conhecimento, mas não dar instruções para fazer uma negociação.
InstaSpot analytical reviews will make you fully aware of market trends! Being an InstaSpot client, you are provided with a large number of free services for efficient trading.


