




Ons team heeft meer dan 7,000,000 handelaren!
Elke dag werken we samen om de handel te verbeteren. We behalen hoge resultaten en gaan verder.
Erkenning door miljoenen handelaren over de hele wereld is de beste waardering voor ons werk! U heeft uw keuze gemaakt en wij zullen er alles aan doen om aan uw verwachtingen te voldoen!
Wij zijn samen een geweldig team!
InstaSpot. Trots om voor je te werken!





Acteur, UFC 6-toernooikampioen en een echte held!
De man die zichzelf heeft gemaakt. De man die onze kant op gaat.
Het geheim achter het succes van Taktarov is een constante beweging naar het doel.
Onthul alle kanten van je talent!
Ontdekken, proberen, falen - maar nooit stoppen!
InstaSpot. Je succesverhaal begint hier!

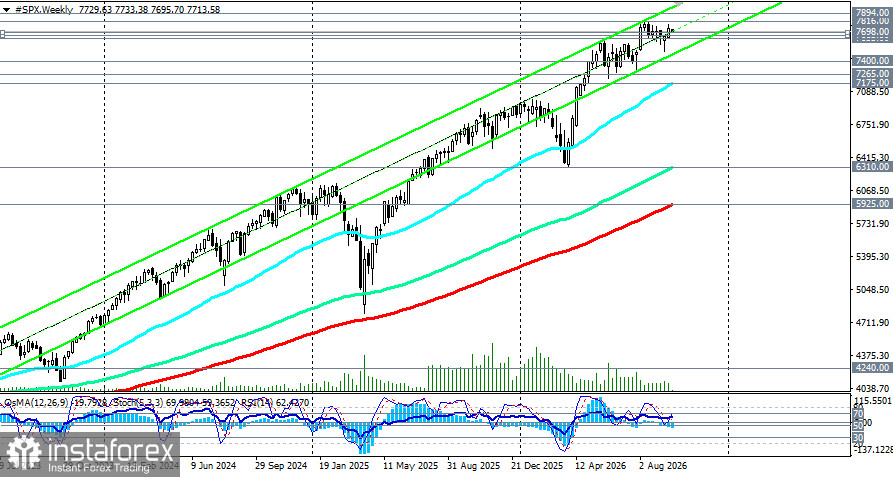
The S&P 500 is holding near record highs, supported by a tech-led rally and strong corporate profits. However, the upside is limited by bond yields at multi-year peaks and the risk of an October rate hike.
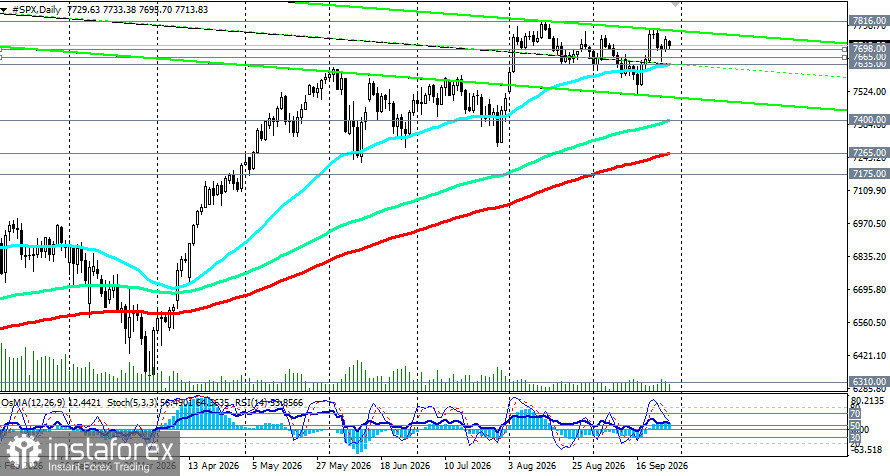
Technically, the daily picture remains moderately bullish, but short-term indicators point to overheating and possible consolidation. On the 1-hour chart, the price is easing toward the key support level of 7,698 (200-EMA), from which a bounce is possible if the broader bullish backdrop holds.
Buy entries can be considered on a sustained breakout of local resistance at 7,760, with targets at 7,800–7,850 and a stop-loss order below 7,665 (200-EMA on the 4-hour chart).
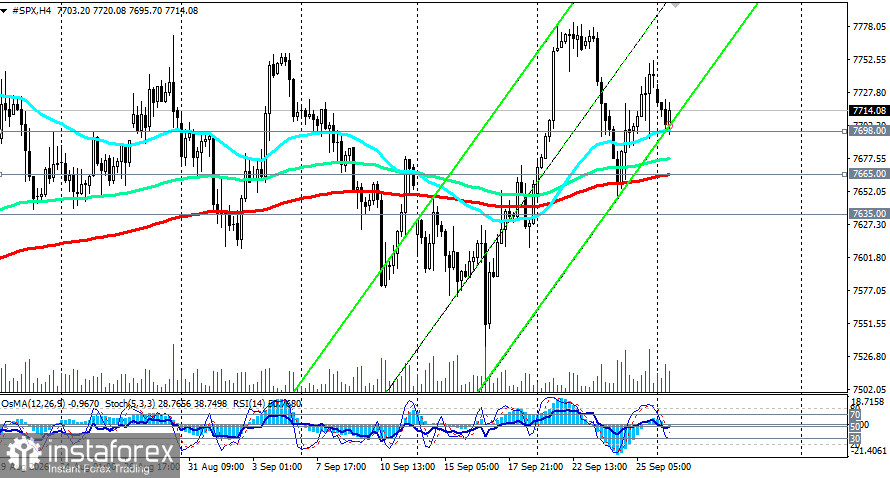
Conditions for the bullish scenario:
Short positions can be considered on a break of 7,698 and then 7,665, with targets at 7,635 (50?EMA on the daily)–7,585 and a stop-loss order above 7,760.
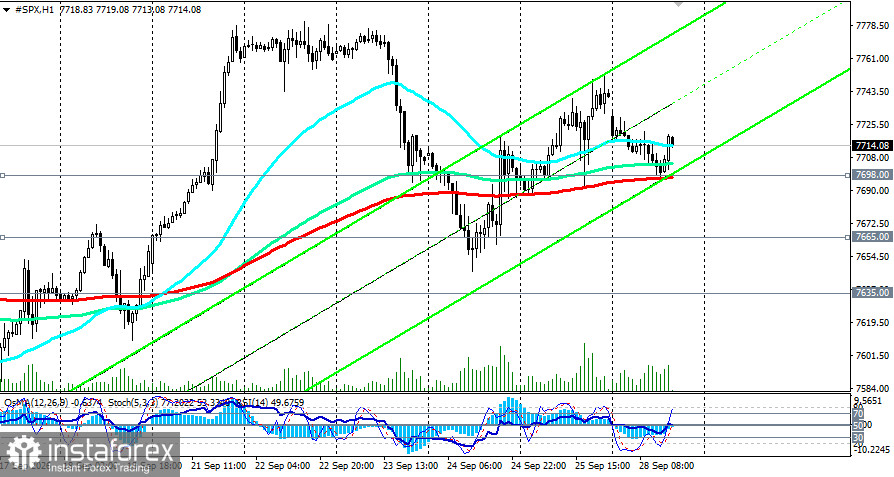
A deeper correction targets the important medium-term support near 7,400 (round level and 144-EMA on the daily).
Conditions for the bearish scenario:
Summary (base case): consolidation in 7,635–7,800 with a bullish tilt ahead of PCE and NFP. A break above the range opens 7,820–7,900; a break below points to 7,585–7,550.
Logic:
Trading scenarios
Bullish (resistance breakout):
Bearish (support breakout):
Notes: "Targets" correspond to support/resistance levels used as planning reference points — not guarantees of execution. Use them to size positions, set stop-loss orders, and manage risk.
*The market analysis posted here is meant to increase your awareness, but not to give instructions to make a trade.
InstaSpot analytical reviews will make you fully aware of market trends! Being an InstaSpot client, you are provided with a large number of free services for efficient trading.


