




Ons team heeft meer dan 7,000,000 handelaren!
Elke dag werken we samen om de handel te verbeteren. We behalen hoge resultaten en gaan verder.
Erkenning door miljoenen handelaren over de hele wereld is de beste waardering voor ons werk! U heeft uw keuze gemaakt en wij zullen er alles aan doen om aan uw verwachtingen te voldoen!
Wij zijn samen een geweldig team!
InstaSpot. Trots om voor je te werken!





Acteur, UFC 6-toernooikampioen en een echte held!
De man die zichzelf heeft gemaakt. De man die onze kant op gaat.
Het geheim achter het succes van Taktarov is een constante beweging naar het doel.
Onthul alle kanten van je talent!
Ontdekken, proberen, falen - maar nooit stoppen!
InstaSpot. Je succesverhaal begint hier!

Bitcoin has traded in a sideways channel for almost a month. Last week, price formed a deviation at the lower boundary of the small sideways channel and literally shot up to the upper boundary, as we warned. But what next? A new move back to the lower boundary within the flat? Bitcoin's current inability to push higher does not mean the local "north impulse" is over. However, that impulse remains local. On the daily timeframe, "digital gold" is clearly inside a sideways channel. Over the past month, Bitcoin has been trading near the upper boundary of that channel. That implies a deviation could form with liquidity taken from the previous high or at least a simple rejection. In any case, the downtrend remains unbroken, as shown on the daily and weekly timeframes.
As soon as Bitcoin began to rise, sentiment among Michael Saylor and other crypto enthusiasts immediately improved, and we again hear forecasts of $250,000 by year-end. Over the weekend, the former head of Strategy published a "Bitcoin Tracker" chart that the company uses to track its Bitcoin reserves. Saylor also added the phrase "more orange" to his post. Previously, the orange dots on the chart indicated BTC purchases. Thus, the analyst hints that Strategy may return to replenishing its Bitcoin reserves soon. This is likely intended as a signal to other traders and investors that it's time to buy crypto again.
We are not discouraging anyone from buying, yet in our view Strategy's approach and Michael Saylor personally have long failed to prove sustainable. Over six years of investing in Bitcoin, the returns for the firm are close to zero. Of course, if Bitcoin rises to $100k or $1m, the company's profits would be counted in billions. The question is whether such growth is likely and why Bitcoin might rise in the near term. If it's purely pumping, then one can only watch. If moves are logical, Bitcoin may begin a new downward phase.
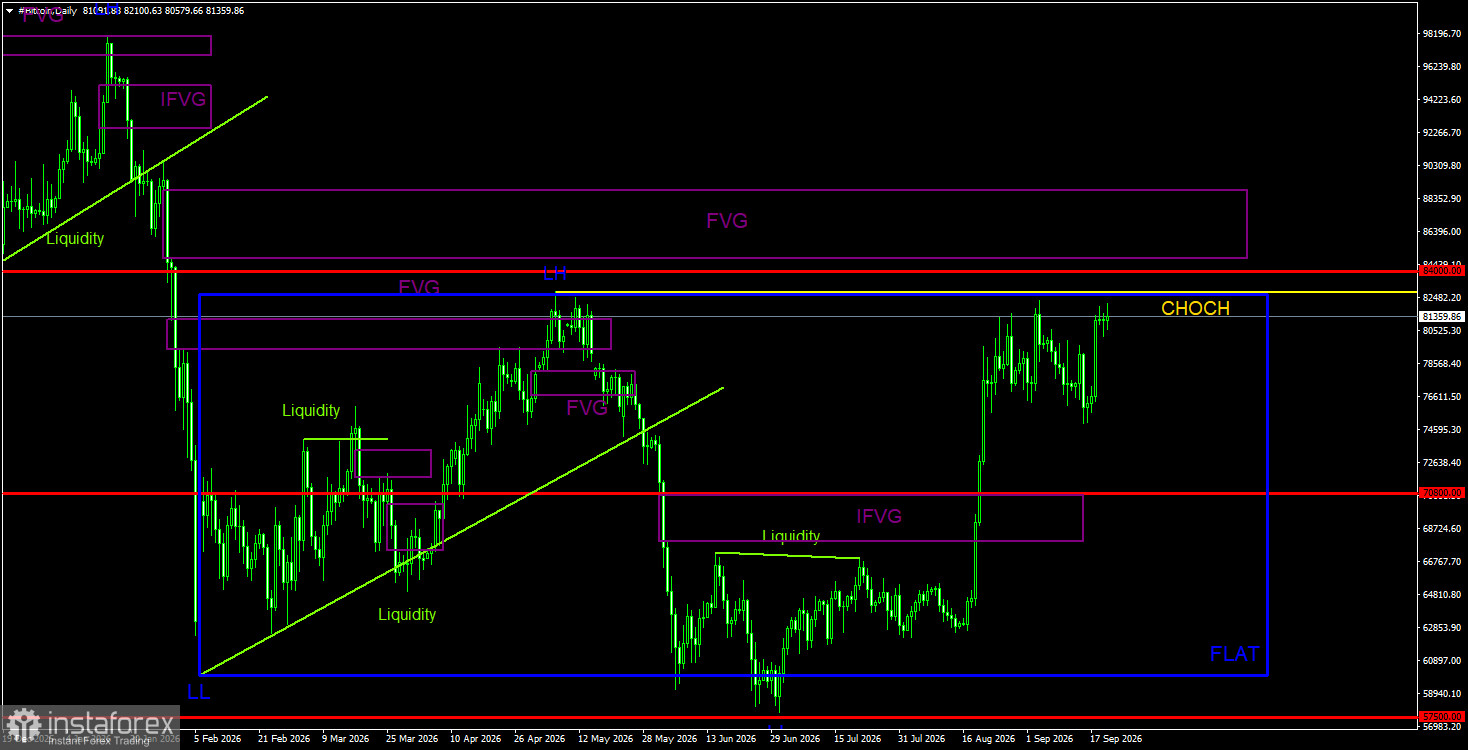
On the daily timeframe, Bitcoin continues to form a downtrend and is currently in a flat phase. The trend structure is identified as downward, and the CHOCH line sits at $82,800, where the last LH (Lower High) formed. Only above that level can the downtrend be considered complete. For most of 2026, "digital gold" has traded between $60,000 and $82,500, which means price can take liquidity from the last LH and begin a new move toward the lower boundary of the sideways channel.
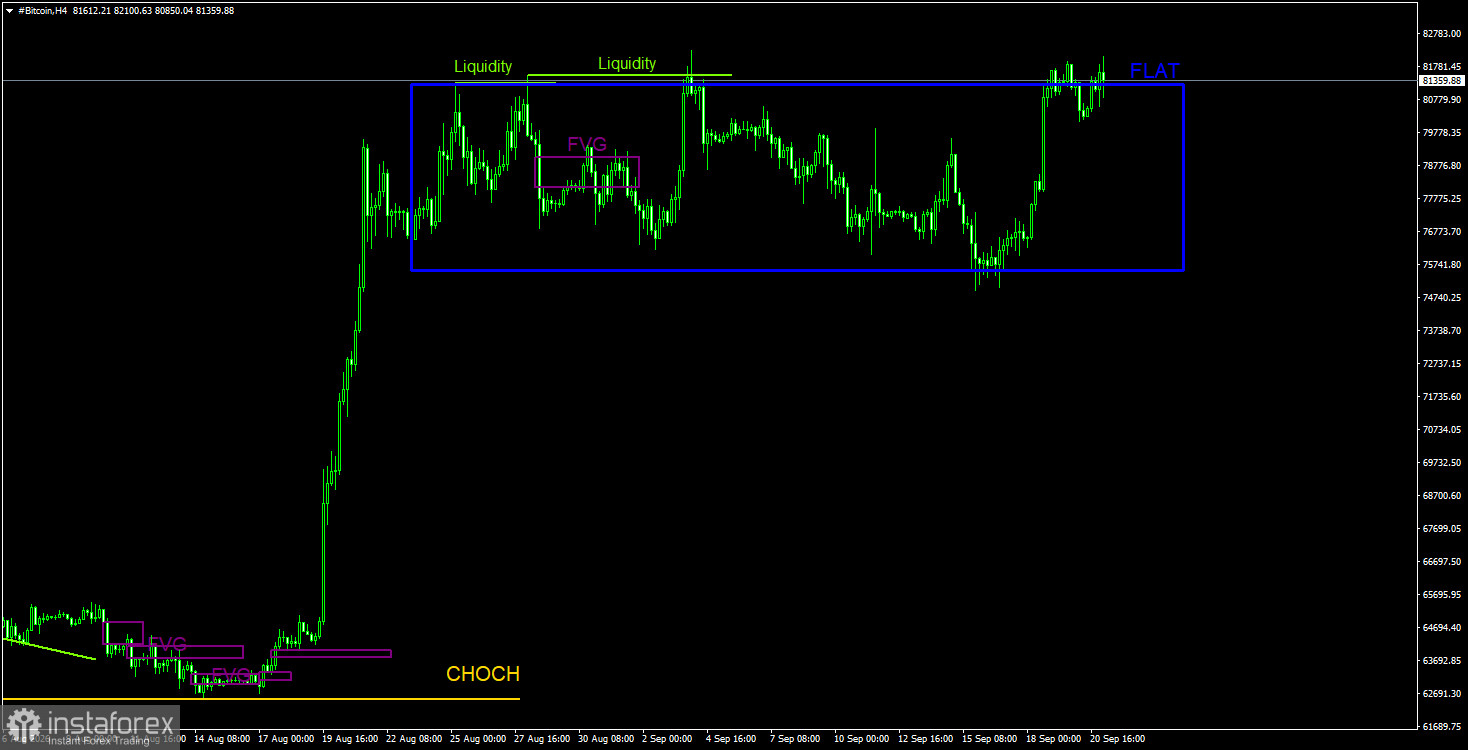
On the 4-hour timeframe, Bitcoin is also in an obvious flat. A deviation formed near the lower boundary of the sideways channel, which immediately triggered a move to the upper boundary. As long as price remains within the $75,600–81,200 channel, we advise traders to trade only from the channel boundaries. Internal patterns currently do not matter. Price has again reached the channel's upper boundary and may form a deviation there. Therefore, a new leg toward $75,600 is possible in the near term.
Bitcoin continues forming a downtrend despite the strong rally in mid-August. We continue to expect a drop toward $57,500 (the 61.8% Fibonacci level of the three-year uptrend), although that level has effectively already been worked. We do not believe the downtrend is over. The recent rise of the top cryptocurrency only weakly resembles a correction, which is not a sufficient reason to open longpositions. Liquidity may be taken from the $82,850 high, which could provoke a new leg down. On the 4-hour timeframe, a new downward phase may begin with targets at $78,400 and $75,600, since a new deviation could form near the upper boundary of the sideways channel.
CHOCH – change of trend structure.
Liquidity – liquidity, Stop Losses, pending orders that market-makers use to accumulate positions.
FVG – Fair Value Gap. A price area of inefficiency. Price passes through these areas quickly, indicating the absence of one side in the market. Subsequently, price tends to return and react to such areas in continuation of the main trend.
IFVG – Inverted Fair Value Gap. After returning to such an area, price doesn't react; it impulsively breaks it and then tests it from the other side.
OB – Order block. The candle where a market-maker opened a position aiming to take liquidity to form their own position in the opposite direction.
*The market analysis posted here is meant to increase your awareness, but not to give instructions to make a trade.
InstaSpot analytical reviews will make you fully aware of market trends! Being an InstaSpot client, you are provided with a large number of free services for efficient trading.


