




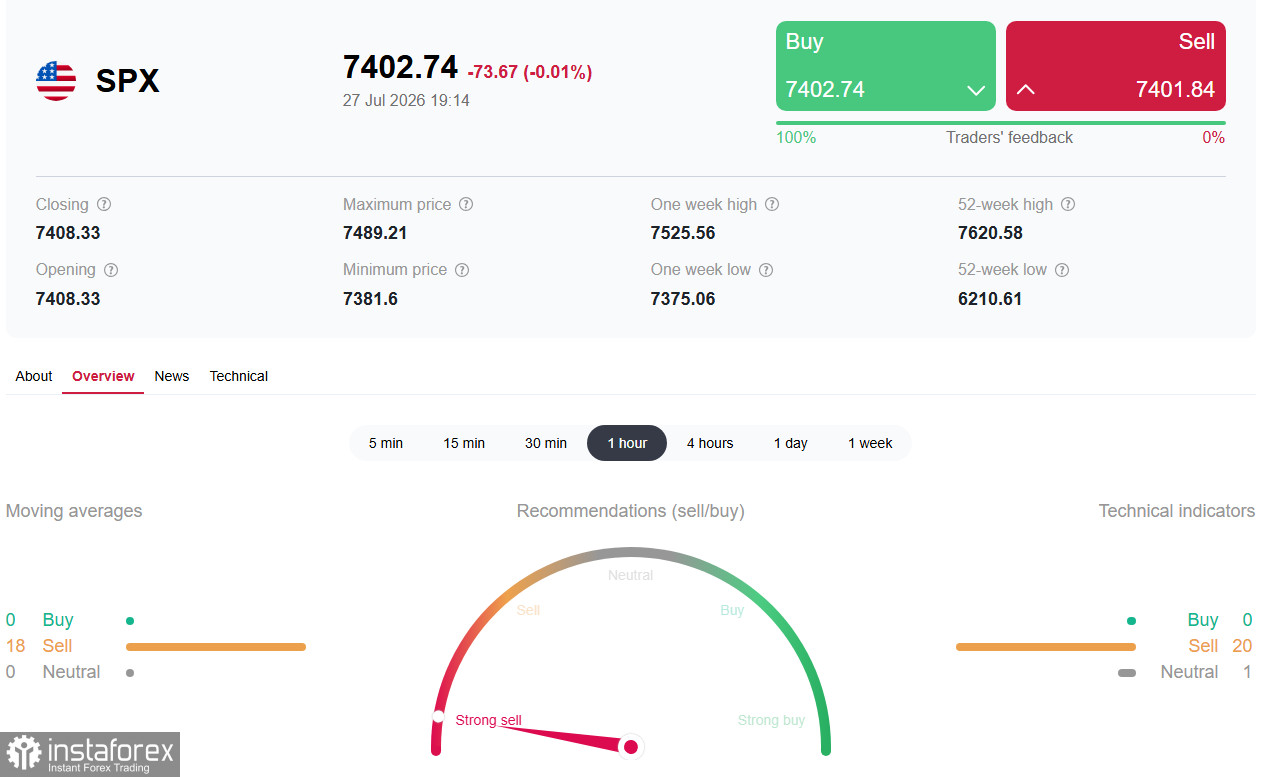
*See also: InstaSpot trading indicators for S&P 500 (SPX)
The S&P 500 enters a decisive week, balancing around the key support area of 7,420–7,400 after a failed mid-month attempt to hold above record highs. The index finished last week down 0.66% amid renewed Middle East escalation that pushed Brent above $100/bbl and lingering doubts about the durability of AI-driven investment returns. On Monday, S&P futures initially rallied by roughly 0.9% in Asian trading as a temporary pause in US–Iran strikes sent oil sharply lower. However, selling resumed after the opening bell in the US.
The announcement of a temporary cessation of strikes between the US and Iran drove WTI down more than 7%, easing some inflation concerns and improving risk appetite. Market participants caution, though, that the reasons for the pause remain unclear and that shipping through the Strait of Hormuz has not meaningfully normalized, leaving upside risks for oil.
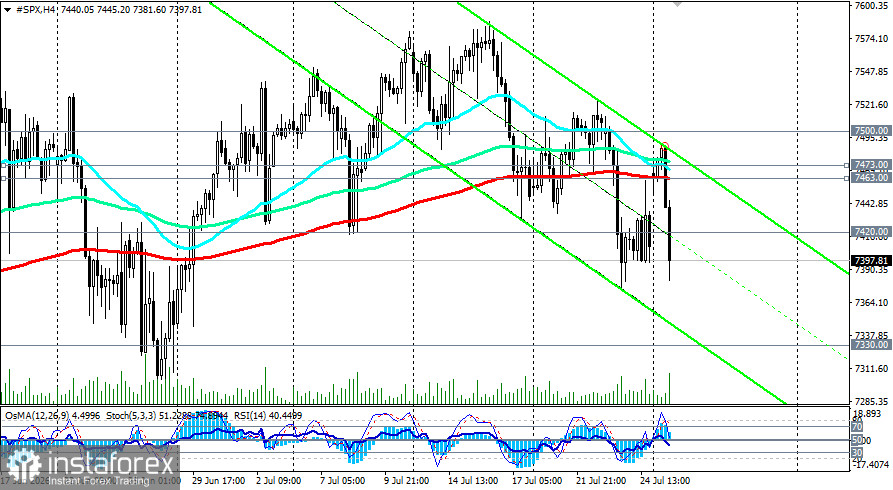
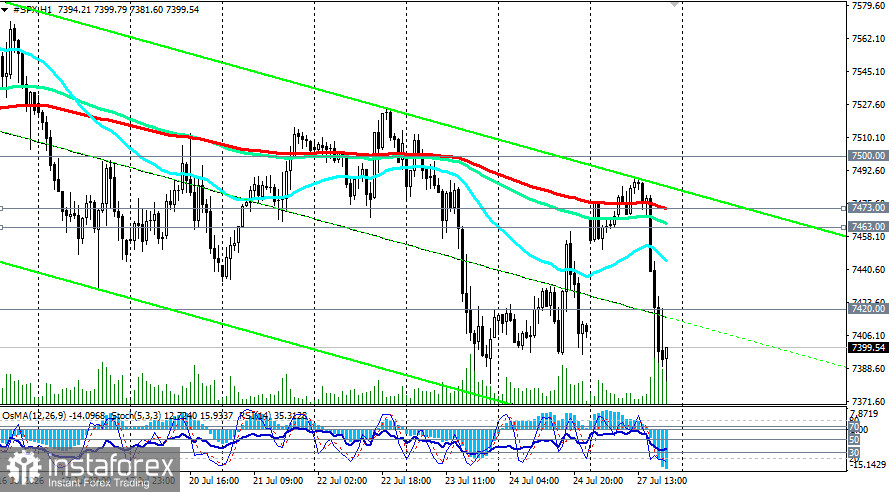
From a technical perspective, the S&P 500 is sitting on a critical pivot, consolidating within a multi-month trading range. The index is trading close to key support levels at 7,420.00 (50-day EMA on the daily chart) and 7,400.00. A decisive break below this area could provoke a deeper correction. At the time of writing, S&P 500 futures are trading in the 7,390–7,400 range.
Daily chart indicators are signaling downside risk:
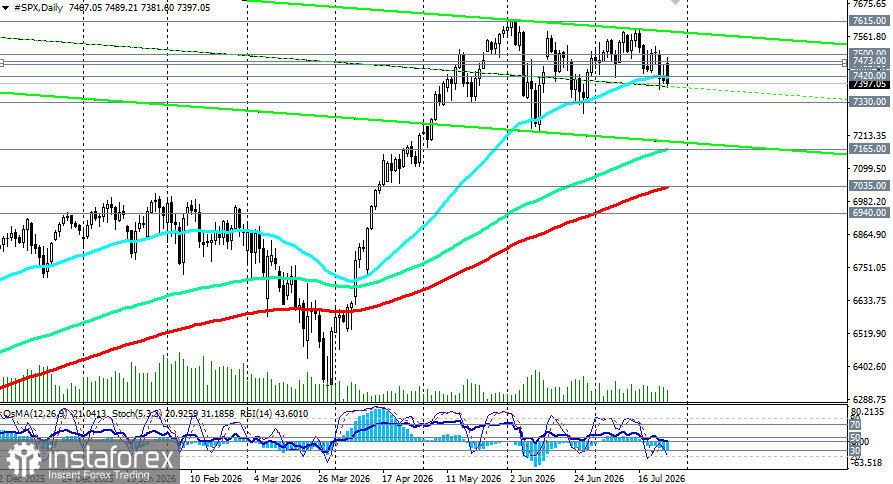
Immediate resistance is located at 7,400.00 and 7,420.00. Further up, resistance sits at 7,463.00 and 7,473.00 (200-EMA on the 4- and 1-hour charts). A confirmed breakout above 7,500.00, supported by indicator confirmation, would open a path to 7,670.00 and 7,800.00.
Immediate support levels are 7,380.00, 7,300.00, 7,225.00 (June low), and 7,200.00.
See also: S&P 500 (SPX): scenario outlook for 27.07.2026 for more detail
| Date | Event | Forecast / Expectation | Expected impact on S&P 500 |
| July 28 | SK Hynix earnings | Expected strong results | Impacts sentiment in the semiconductor sector |
| July 28-29 | Fed meeting | Policy rate expected to remain at 3.50–3.75% | Dovish signals = support; hawkish = pressure |
| July 29 | Meta, Microsoft earnings | Expected strong results | Key driver for the tech sector |
| July 30 | US Q2 GDP | Forecast: +2.3% y/y | Strong data = market support |
| 30 July | Apple, Amazon earnings | Expected strong results | Key driver for the tech sector |
| July 30 | US PCE price inflation | Expected slowdown | Weak print = support; strong = pressure |
| During the week | Geopolitical developments | — | Escalation = pressure; de-escalation = support |
The S&P 500 is at a decisive juncture where a bullish impulse from strong earnings and hopes for geopolitical de-escalation is colliding with bearish pressure from anticipated Fed tightening and lingering risks. The key range of 7,360.00–7,500.00 remains the main watershed for near-term dynamics. This week, the market will focus on Big Tech earnings, the Fed meeting, and geopolitical developments—each capable of providing fresh signals for the next move.
*The market analysis posted here is meant to increase your awareness, but not to give instructions to make a trade.
InstaSpot analytical reviews will make you fully aware of market trends! Being an InstaSpot client, you are provided with a large number of free services for efficient trading.









