


The legend in the InstaSpot team!
Legend! You think that's bombastic rhetoric? But how should we call a man, who became the first Asian to win the junior world chess championship at 18 and who became the first Indian Grandmaster at 19? That was the start of a hard path to the World Champion title for Viswanathan Anand, the man who became a part of history of chess forever. Now one more legend in the InstaSpot team!


Borussia is one of the most titled football clubs in Germany, which has repeatedly proved to fans: the spirit of competition and leadership will certainly lead to success. Trade in the same way that sports professionals play the game: confidently and actively. Keep a "pass" from Borussia FC and be in the lead with InstaSpot!

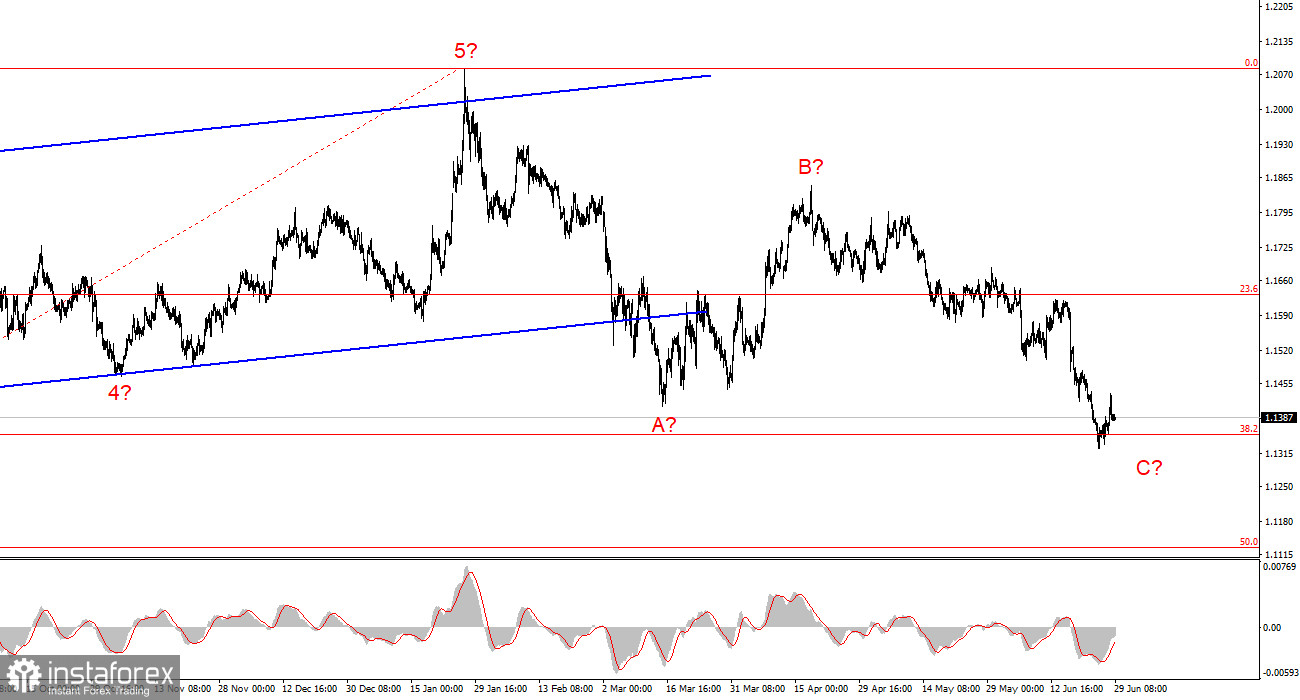
The 4-hour wave structure for EUR/USD continues to grow more complex. There is still no indication that the broader bullish trend, which began in January of last year (see the lower chart), has been invalidated. However, the wave structure has now taken on a corrective form. From a long-term perspective, wave C is expected to develop, with its low projected below the low of wave A. At present, the low of wave C has already moved below the low of wave A, meaning that wave C could be completed at any time. Nevertheless, geopolitical developments have once again come to the forefront. Hostilities in the Middle East have resumed, which could theoretically increase demand for the U.S. dollar. Consequently, wave C may extend further than currently anticipated, especially since its internal structure does not yet appear complete.
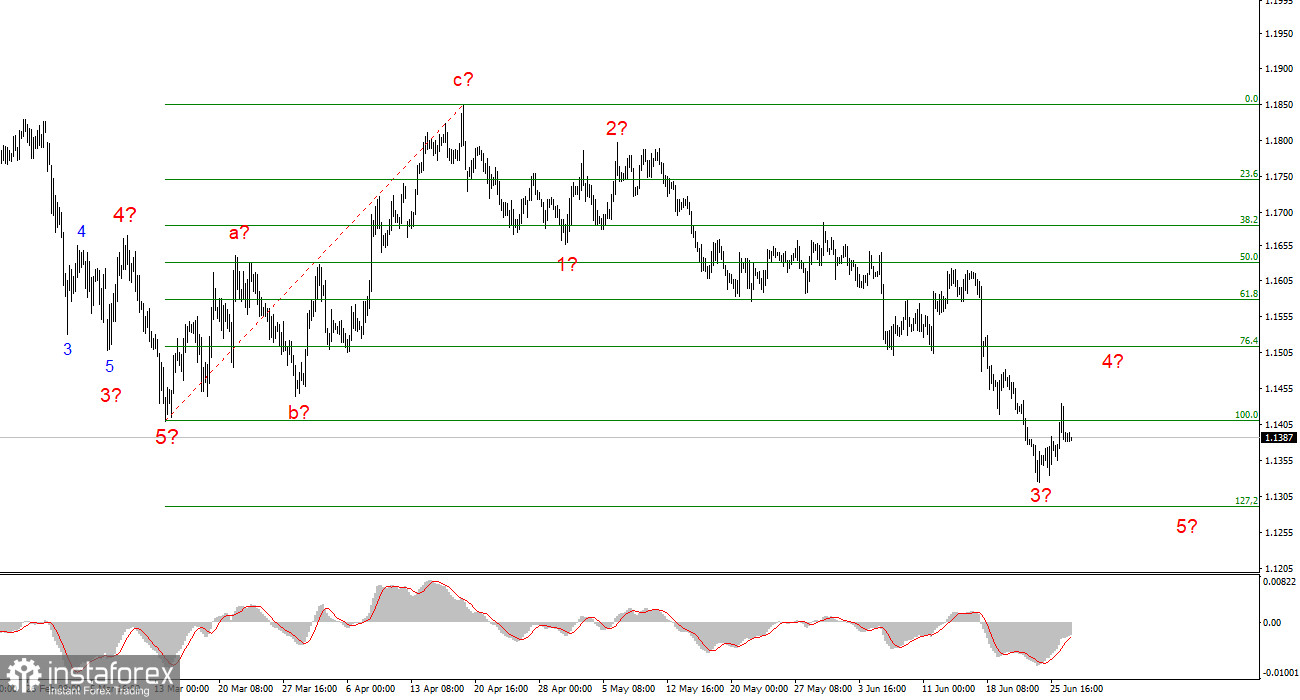
On the lower time frame, I can identify a classic five-wave bearish structure. If this interpretation is correct, wave 3 is currently unfolding and has itself taken on a clear five-wave form. Once this structure is complete, the instrument may begin a new upward wave sequence. However, according to the current wave count, wave 5 still remains to be formed.
EUR/USD gained 10 points on Friday, but a new trading week has already begun, and developments in the Middle East are once again unfolding rapidly. Over the weekend, it became known that hostilities between Iran and the United States had resumed. The situation followed a familiar pattern. Iran seeks to maintain full control over the Strait of Hormuz and considers it its sovereign right to target commercial vessels attempting to pass through the strait outside designated shipping lanes or in violation of established regulations. The United States insists that the strait must remain open to free navigation and considers it its responsibility to respond militarily to any acts of aggression by Iran.
However, as I have noted repeatedly, neither Donald Trump nor Tehran is interested in returning to a full-scale war. After several days of renewed fighting, both sides agreed to suspend hostilities and reached yet another ceasefire agreement—this time concerning the Strait of Hormuz.
At present, it remains unclear whether the strait has been fully reopened. Most likely, some vessels are transiting the passage, but traffic remains limited. Negotiations on a long-term peace agreement between Iran and the United States have resumed, although the key issues surrounding Iran's nuclear program and control of the Strait of Hormuz remain unresolved. In addition, Lebanon and Israel remain in a state of conflict, which Tehran views as a violation of the ceasefire agreement with Washington. Therefore, I continue to believe that the conflict is likely to evolve into a prolonged, low-intensity confrontation lasting for months or even years.
According to various insider reports, Iran still refuses to export its entire stockpile of enriched uranium and is prepared only to pledge that it will not develop nuclear weapons. Clearly, such a position is unlikely to satisfy Washington. Or perhaps Donald Trump will ultimately have to accept it.
Based on my EUR/USD analysis, I conclude that the pair remains within its broader bullish trend (see the lower chart), while the shorter-term trend remains bearish. In my view, conditions are gradually becoming favorable for considering long positions. However, the pair could still fall well below the 1.1400 level as part of wave C. If this scenario proves correct, it may be prudent to wait until wave 5 within wave C has formed. Nevertheless, wave structures often produce unexpected developments, so I would already begin shifting my outlook toward buying opportunities.
On the higher time frame, the broader bullish trend remains visible, followed by the development of a corrective wave structure. In the near term, wave C is expected to continue toward the 1.1352 level, corresponding to the 38.2% Fibonacci retracement level. Once the A-B-C correction is complete, a new long-term bullish trend may begin.
*The market analysis posted here is meant to increase your awareness, but not to give instructions to make a trade.
InstaSpot analytical reviews will make you fully aware of market trends! Being an InstaSpot client, you are provided with a large number of free services for efficient trading.


