


Ons team heeft meer dan 7,000,000 handelaren!
Elke dag werken we samen om de handel te verbeteren. We behalen hoge resultaten en gaan verder.
Erkenning door miljoenen handelaren over de hele wereld is de beste waardering voor ons werk! U heeft uw keuze gemaakt en wij zullen er alles aan doen om aan uw verwachtingen te voldoen!
Wij zijn samen een geweldig team!
InstaSpot. Trots om voor je te werken!


Acteur, UFC 6-toernooikampioen en een echte held!
De man die zichzelf heeft gemaakt. De man die onze kant op gaat.
Het geheim achter het succes van Taktarov is een constante beweging naar het doel.
Onthul alle kanten van je talent!
Ontdekken, proberen, falen - maar nooit stoppen!
InstaSpot. Je succesverhaal begint hier!

Bitcoin and Ethereum have continued an upward move that has been a correction for almost three months. This is clearly visible on the daily timeframe. Liquidity pools below remain untouched — price tends to sweep them with about a 90% probability. However, the market remains apathetic and stupefied and simply does not know where to go next. There are neither the fundamentals nor the demand for a new bullish trend, while the market also does not yet seem ready for a new leg of a bearish trend.
Meanwhile, analyst, trader, and investor Peter Brandt warned that Bitcoin has not yet reached its "bottom" in the current cycle. Mr. Brandt noted the ascending channel that Bitcoin has been trading in for three months, and that the price is currently near its upper band, where the recovery could end. Brandt also pointed to the $79,145 level — below which the probability of Bitcoin falling to the lower band of the ascending channel (i.e., to around $70,000) would increase significantly. Earlier, he had forecast a drop of the "digital gold" to $58,000–$62,000. However, the expert also notes that the long?term outlook for the leading cryptocurrency remains broadly favorable. If Bitcoin's cyclical model holds, its next peak could be in the $300k–$500k range sometime around 2029.
We doubt the usual cyclical model will work forever. Remember, for the first time in its history, Bitcoin showed a decline in the year following a halving. Spot demand, which underpins a trend, remains weak. The last three months' movement is clearly a correction, and after a correction, the trend resumes.
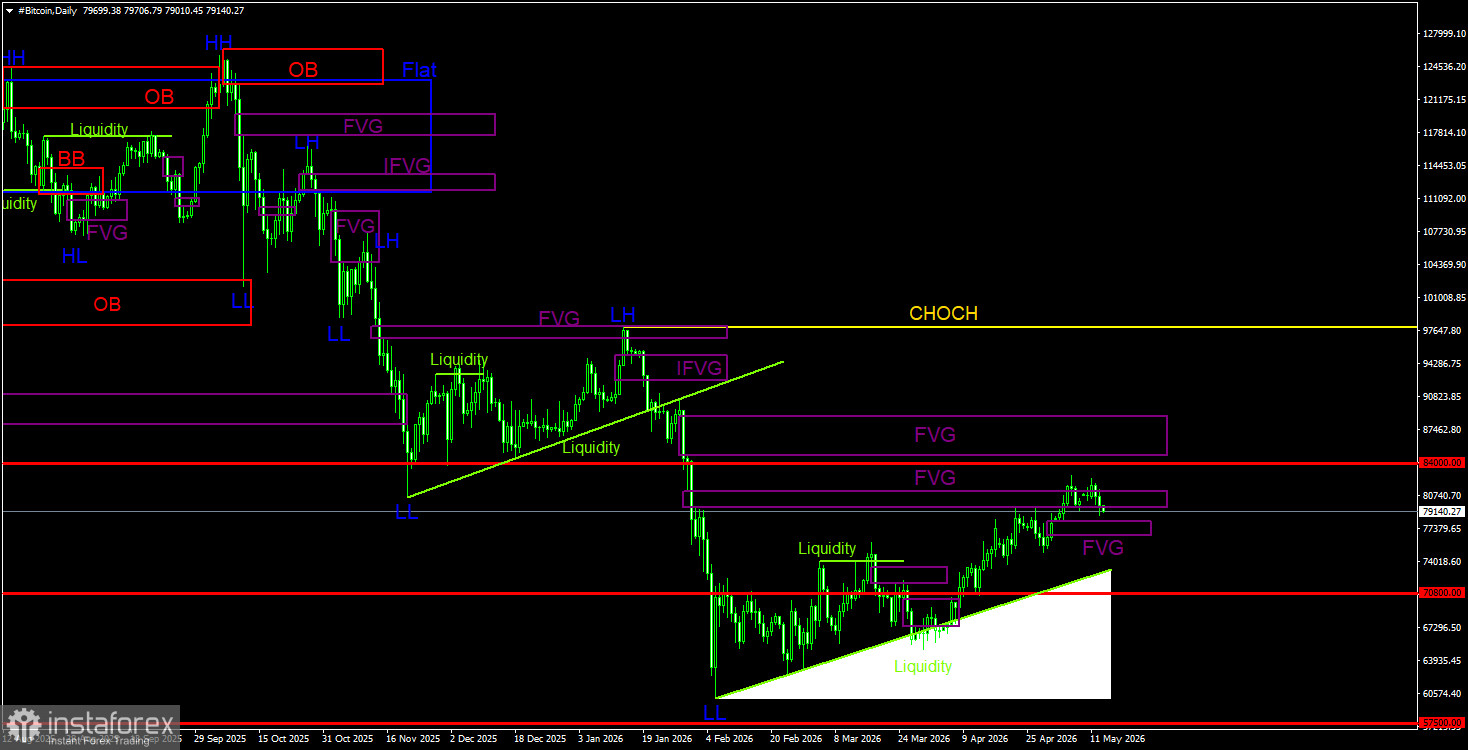
Bitcoin continues forming a full-fledged downtrend with corrective moves against it. We still expect a drop with a target of $57,500 (the 61.8% Fibonacci retracement of the three?year uptrend), and there are currently no signs of a trend reversal. Of the POIs (points of interest) now, only the nearest bearish FVG on the daily timeframe — in the $79,300–$81,200 area — can be noted. It has not been fully invalidated yet, but it may be in the near future. In that case, the POI for short entries would become $84,900–$88,800 (the next bearish FVG). Downside targets remain below $60,000. For long positions, you can use the single bullish FVG on the daily TF, but bear in mind that any crypto rise now is, a priori, a correction.
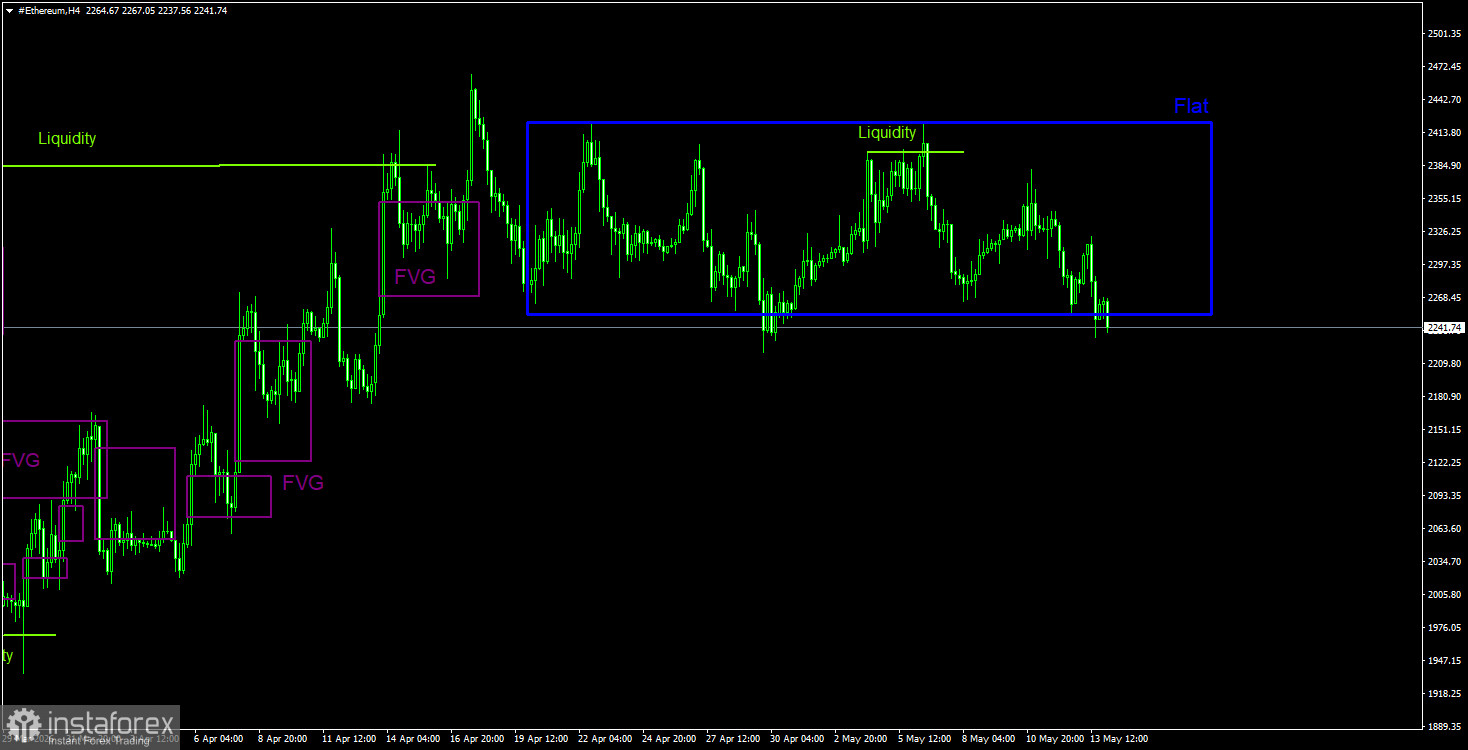
A downtrend and corrective moves against it continue to form on the daily TF. The key sell pattern has been and remains the bearish order block on the weekly TF. As we warned, the move triggered by this signal can be strong and prolonged. We do not believe it is complete, since there are no signs of a finished downtrend in either Bitcoin or Ethereum. In the near term, Ethereum may continue a weak upward correction, but all corrections end sooner or later. A sell signal may appear on the daily TF at the nearest FVG, and Bitcoin may form a similar signal. Therefore, in the near term, we would advise monitoring breaks of structure on lower timeframes and the formation of bearish patterns (or reactions to them) on higher timeframes. The target at the 2026 low — $1,744 — looks quite achievable. On the 4?hour TF, in the short term, deviations can be used to open positions during a range.
CHOCH — change of character / break of the trend structure. Liquidity — liquidity, traders' Stop?Losses that market?makers use to build their positions. FVG — Fair Value Gap (area of price inefficiency). The price often moves quickly through such areas, indicating the absence of one side in the market. Later, the price tends to return and react to these zones. IFVG — Inverted Fair Value Gap. After a return to such a zone, the price does not react but impulsively breaks through and then tests it from the other side.
OB — Order Block. A candle on which a market?maker opened a position in order to harvest liquidity and then form their own position in the opposite direction.
*The market analysis posted here is meant to increase your awareness, but not to give instructions to make a trade.
InstaSpot analytical reviews will make you fully aware of market trends! Being an InstaSpot client, you are provided with a large number of free services for efficient trading.


