


The legend in the InstaSpot team!
Legend! You think that's bombastic rhetoric? But how should we call a man, who became the first Asian to win the junior world chess championship at 18 and who became the first Indian Grandmaster at 19? That was the start of a hard path to the World Champion title for Viswanathan Anand, the man who became a part of history of chess forever. Now one more legend in the InstaSpot team!


Borussia is one of the most titled football clubs in Germany, which has repeatedly proved to fans: the spirit of competition and leadership will certainly lead to success. Trade in the same way that sports professionals play the game: confidently and actively. Keep a "pass" from Borussia FC and be in the lead with InstaSpot!

The GBP/USD currency pair continued its downward movement on Wednesday amid a series of negative factors, including geopolitical issues, US inflation, and the political crisis in the UK. However, in the second half of the day, the British currency recovered and halted its relentless decline. Thus, at the current moment, we can say that the GBP/USD pair remains within a flat range, clearly visible on the hourly timeframe. Over the past three days, the pound has shown significant declines, but this has occurred within a sideways channel. Therefore, until it consolidates below the 1.3465-1.3480 area, we would not sound the alarm or consider the upward trend to be over.
On the hourly timeframe, the trend has formally changed to downward, but, as mentioned, it is still flat. Consequently, the Ichimoku indicator lines are unlikely to hold much significance in the near future, and we await a bounce or a break through the area of 1.3465-1.3480 to determine the direction of the next trend. This will largely depend on the geopolitical situation.
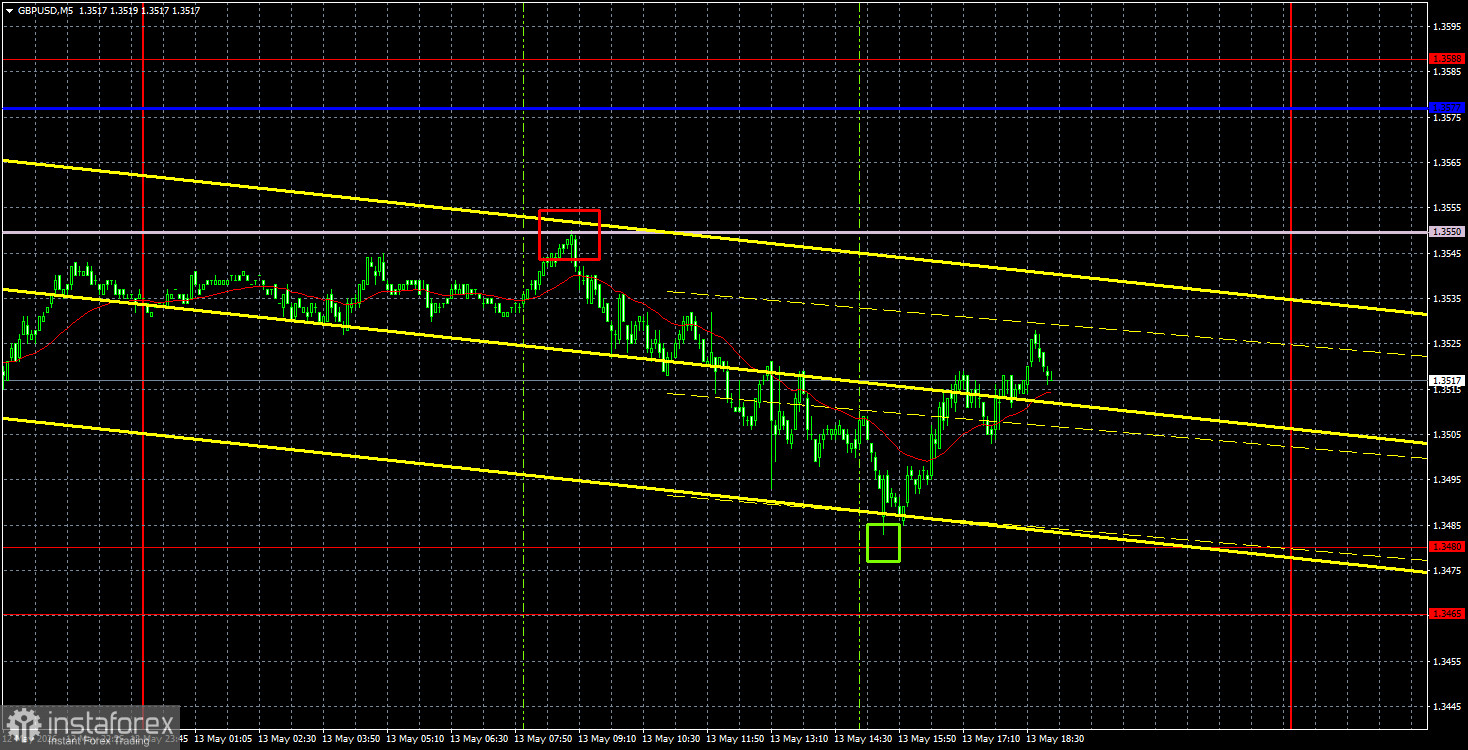
On the 5-minute timeframe, the British pound formed two ideal trading signals yesterday. First, the pair accurately bounced off the Senkou Span B line, then it reacted with minimal deviation to the 1.3480 level. In both cases, traders were able to open positions. The first sell trade yielded a profit of at least 45 pips. The second buy trade could have been manually closed in the evening, resulting in a profit of around 25 pips.
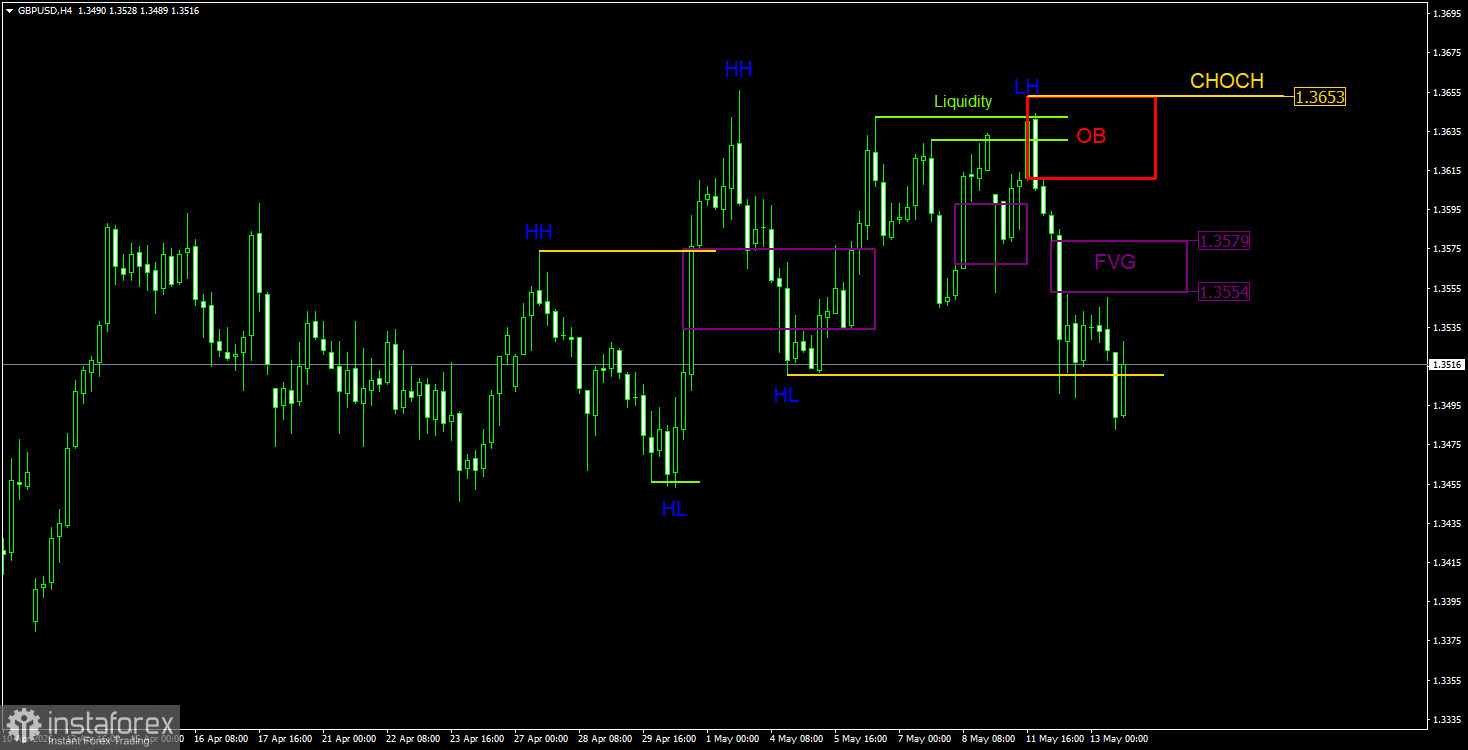
On the 4-hour timeframe, we are analyzing according to the ICT trading system. The exchange rate of the British pound closely correlates with the euro, similar to the relationship between Ethereum and Bitcoin. Therefore, patterns and signals from EUR/USD should always be considered. The trend on the 4-hour timeframe has also changed downward, as the CHOCH line was breached. Consequently, we are currently dealing with a downward trend that lacks confirmation on the hourly timeframe. However, we would consider the nearest "bearish" FVG as a point of interest for opening short positions.
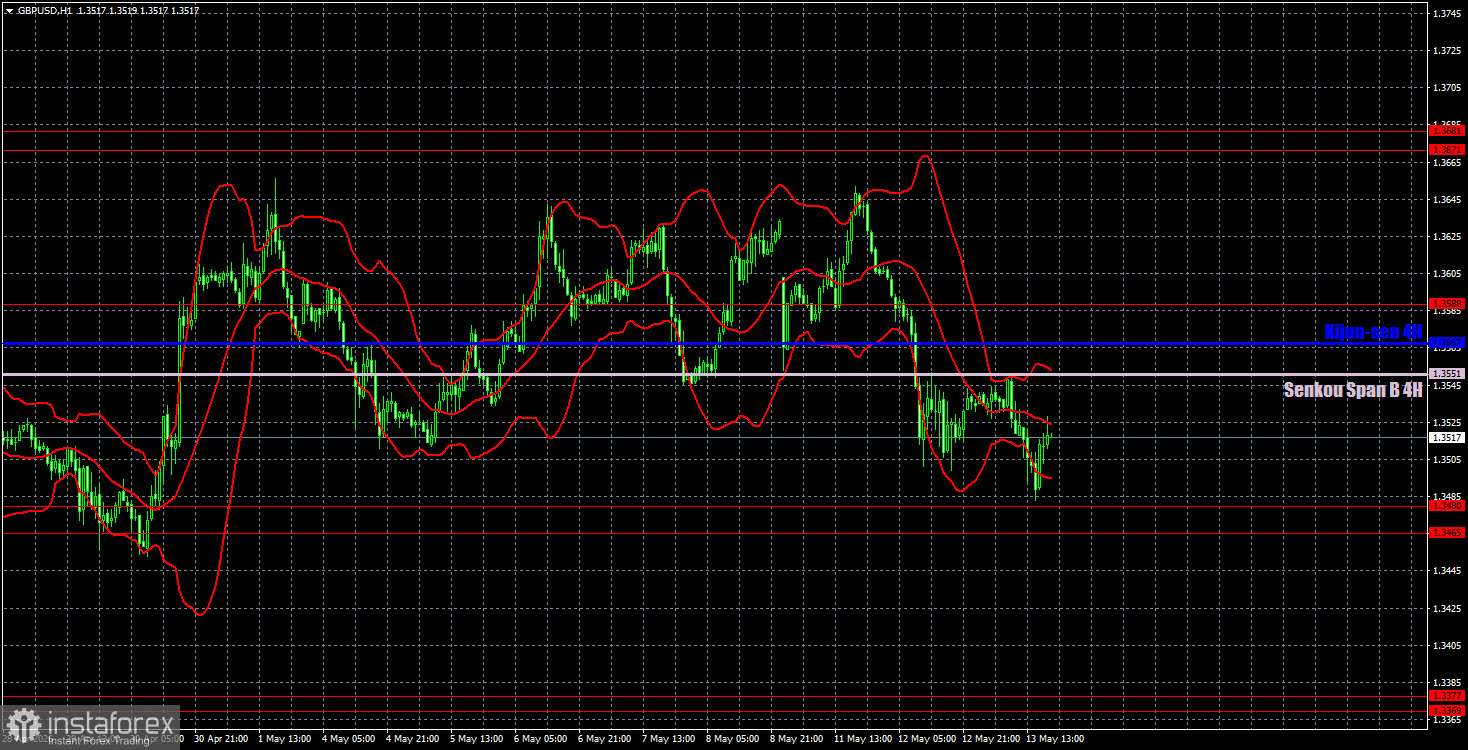
On the hourly timeframe, the GBP/USD pair has shown a notable decline, but one cannot be confident in the downward trend just yet. A sideways channel is visible, so the price may turn upward and return to the 1.3650 level in the near future. Geopolitical factors could hinder this if tensions continue to escalate.
For May 13, we highlight the following important levels: 1.3096-1.3115, 1.3179-1.3187, 1.3369-1.3377, 1.3465-1.3480, 1.3588, 1.3671-1.3681, and 1.3751-1.3763. The Senkou Span B line (1.3550) and Kijun-sen line (1.3567) may also be sources of signals. It is recommended to set a Stop Loss at break-even once the price moves 20 pips in the correct direction. The Ichimoku indicator lines may move during the day, which should be taken into account when determining trading signals.
On Thursday, the UK will release reports on first-quarter GDP and industrial production. We cannot say that these are super-important data, and the market has been ignoring macroeconomics for the past three months. In the US, the events are even less significant—reports on jobless claims and retail sales will be published.
Today, traders may consider short positions if the price consolidates below the 1.3465-1.3480 area, targeting the 1.3377 level. Long positions can be opened on a bounce from the 1.3465-1.3480 area, targeting the Ichimoku indicator lines. On the 4-hour timeframe, short positions can be considered if a signal is received in the FVG 1.3554-1.3579.
*The market analysis posted here is meant to increase your awareness, but not to give instructions to make a trade.
InstaSpot analytical reviews will make you fully aware of market trends! Being an InstaSpot client, you are provided with a large number of free services for efficient trading.


