


EUR/USD
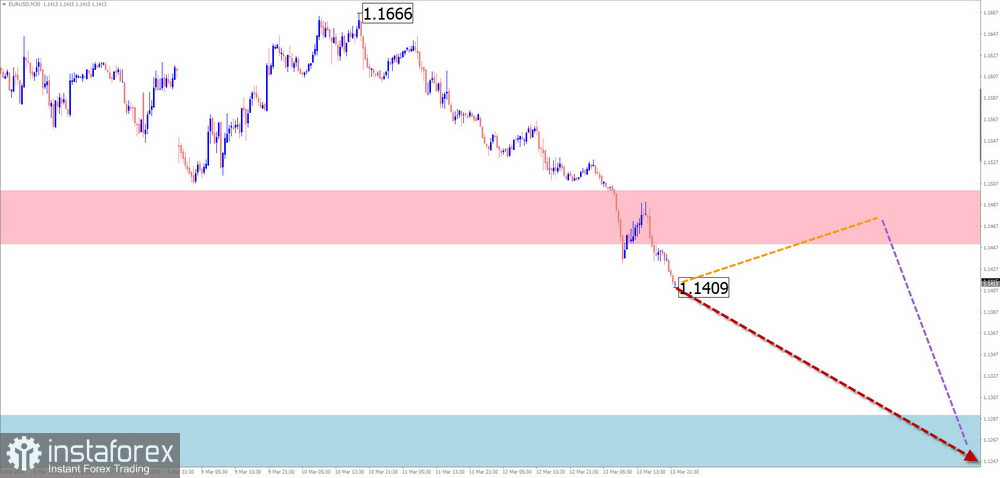
On the chart of the euro, a downward zigzag wave has been forming since February 3 of this year. Analysis of the wave structure shows the development of the final segment (C) within the correction, forming a shifting flat pattern on the chart. Its structure is close to completion. The price is approaching the upper boundary of a strong potential reversal zone.
Over the next week, the price is expected to move sideways between the nearest opposing zones. In the first days, an upward vector is more likely. Closer to the weekend, the probability of a renewed decline in quotes increases, possibly reaching the support boundaries.
Resistance:
Support:
Buying: possible with reduced (partial) position sizes during individual trading sessions.
Selling: there are currently no conditions for such trades until reversal signals appear near the resistance zone.
USD/JPY
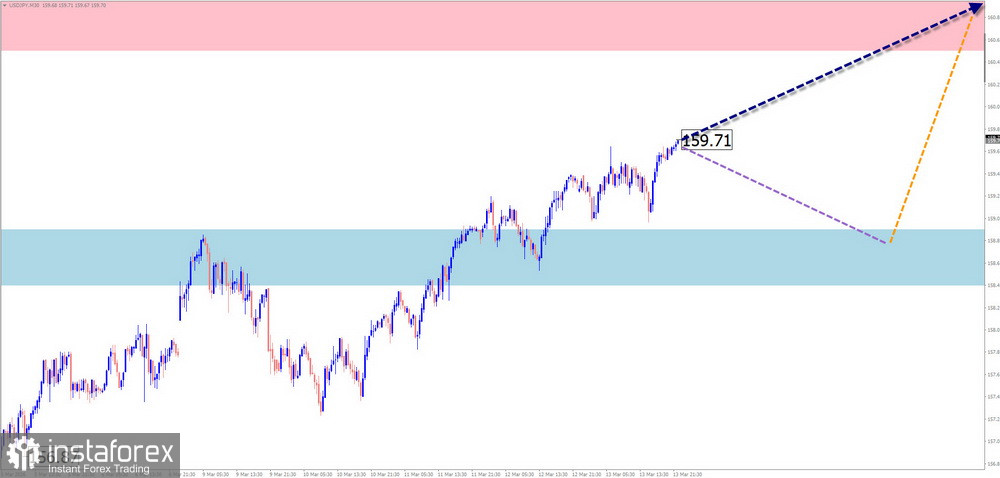
Since July last year, the Japanese yen has been weakening against the US dollar. Within this bullish wave, the final phase (C) has been forming since the end of January this year. Last week, the price reached the lower boundary of a strong weekly resistance zone.
During the upcoming week, the pair is expected to trade mostly sideways. In the first days, a downward move cannot be ruled out. After a possible test of the support zone, a reversal may form, followed by renewed price growth toward the resistance zone.
Resistance:
Support:
Selling: carries a high level of risk; downward potential is limited by the estimated support.
Buying: may become possible after confirmed reversal signals appear near the support zone according to your trading system.
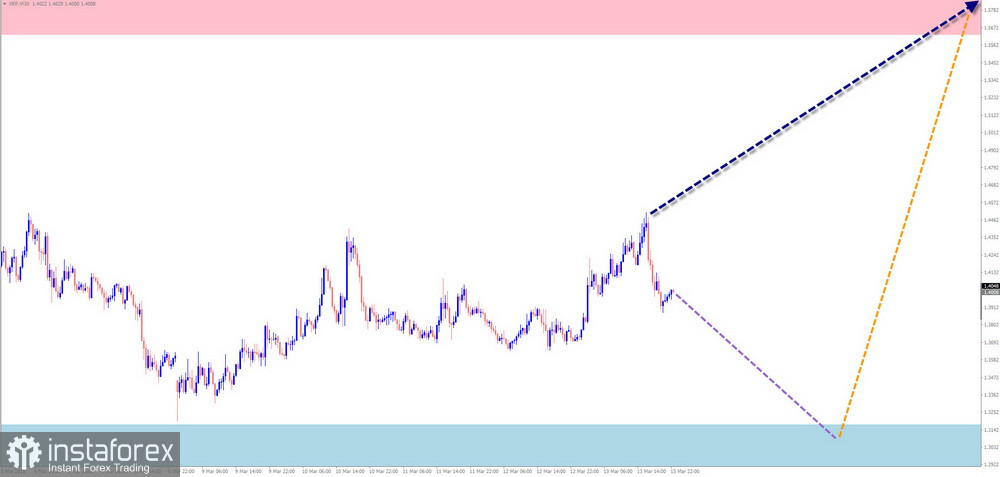
GBP/JPY
The chart of the British pound versus the Japanese yen pair is dominated by a global bullish trend. Since the end of last year, a corrective zigzag wave has been developing in the form of a hidden shifting flat. Its structure is close to completion. The sideways price movement over the past three months forms the beginning of a reversal wave pattern.
At the beginning of the coming week, sideways movement is expected. A decline toward the support zone and pressure on its lower boundary is possible. After that, a change in direction and renewed price growth is expected, accompanied by increasing volatility. A breakout above the calculated resistance within the week is unlikely.

Resistance:
Support:
Buying: there are no conditions for such trades until confirmed reversal signals appear in the support zone.
Selling: may be used with reduced position sizes during individual sessions; downward potential is limited by support.
USD/CAD
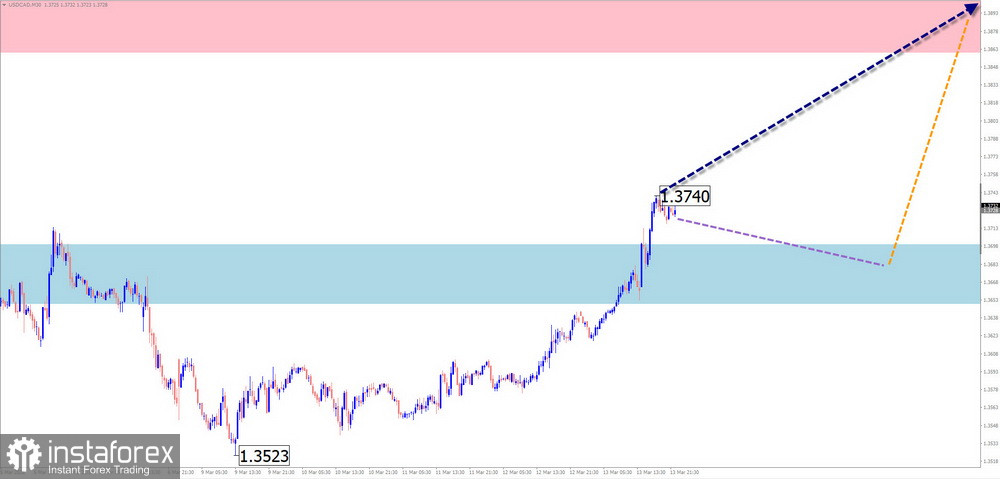
Since January 30 of this year, the short-term trend of the Canadian dollar's main pair has been determined by an upward wave structure. Within it, the final segment (C) is forming. The pair is currently trading in a channel between the nearest potential reversal zones. No ready signals of an imminent trend change are observed on the chart.
In the coming days, a decline toward the support zone is possible. Within this area, a pause and the formation of reversal conditions are likely. A breakout below the calculated support cannot be ruled out if the direction changes. Renewed price growth can be expected closer to the weekend.
Resistance:
Support:
Selling: possible with reduced position sizes; due to limited potential, such trades may be risky.
Buying: may become possible after confirmed signals of a trend change appear near the support zone.
Bitcoin
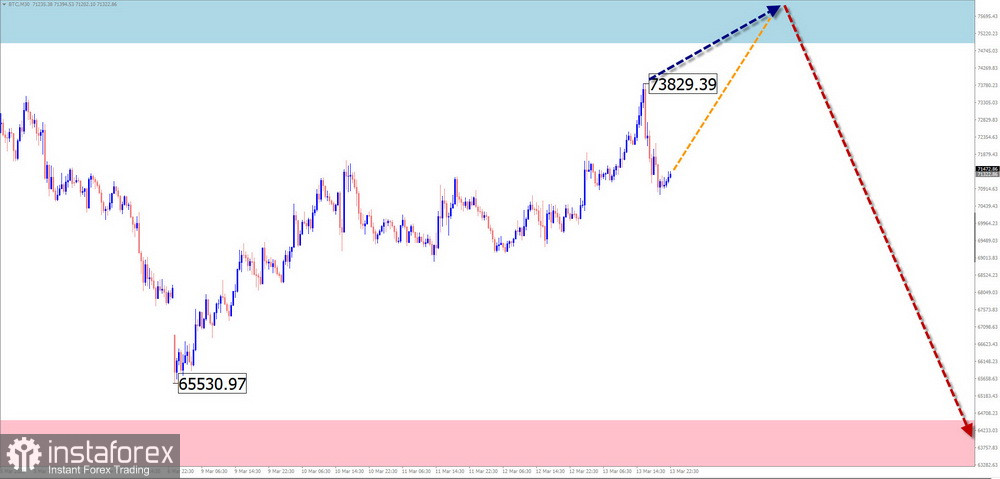
Since July last year, Bitcoin quotes have been forming a downward wave. Within this structure, the final segment (C) is developing. The last two weeks represented an intermediate correction phase. This phase is close to completion. The price is currently near the upper boundary of a potential reversal zone. No confirmed reversal signals are observed yet.
In the coming week, the current upward movement is expected to finish, followed by a reversal and the formation of conditions for renewed price decline. During the change of direction, a brief spike above the upper boundary of the calculated resistance is possible.
Resistance:
Support:
Buying: possible with reduced position sizes for intraday trades.
Selling: premature until appropriate signals appear near the resistance zone.
Ripple
Since February 5 of this year, the price movement of Ripple has been forming an upward wave pattern with reversal potential. In recent weeks, the middle part of the wave has been developing sideways and is not yet completed. Quotes are moving along the upper boundary of a daily-scale potential reversal zone.
At the beginning of the coming week, sideways movement is likely to continue. A decline toward the control zone is possible. Near the calculated support, the probability of a pause and sideways drift increases. Closer to the weekend, a change in direction and a return toward the resistance area can be expected.
Resistance:
Support:
Selling: may be used with smaller position sizes during individual sessions until the first reversal signals appear.
Buying: may become possible after confirmed reversal signals appear near the support zone according to your trading systems.
Notes: In Simplified Wave Analysis (SWA), all waves consist of three parts: A–B–C. On each timeframe, the latest unfinished wave is analyzed. The dashed lines on charts indicate the expected movements.
Attention: The wave algorithm does not account for the time duration of price movements.
*The market analysis posted here is meant to increase your awareness, but not to give instructions to make a trade.
InstaSpot analytical reviews will make you fully aware of market trends! Being an InstaSpot client, you are provided with a large number of free services for efficient trading.


