


The legend in the InstaSpot team!
Legend! You think that's bombastic rhetoric? But how should we call a man, who became the first Asian to win the junior world chess championship at 18 and who became the first Indian Grandmaster at 19? That was the start of a hard path to the World Champion title for Viswanathan Anand, the man who became a part of history of chess forever. Now one more legend in the InstaSpot team!


Borussia is one of the most titled football clubs in Germany, which has repeatedly proved to fans: the spirit of competition and leadership will certainly lead to success. Trade in the same way that sports professionals play the game: confidently and actively. Keep a "pass" from Borussia FC and be in the lead with InstaSpot!

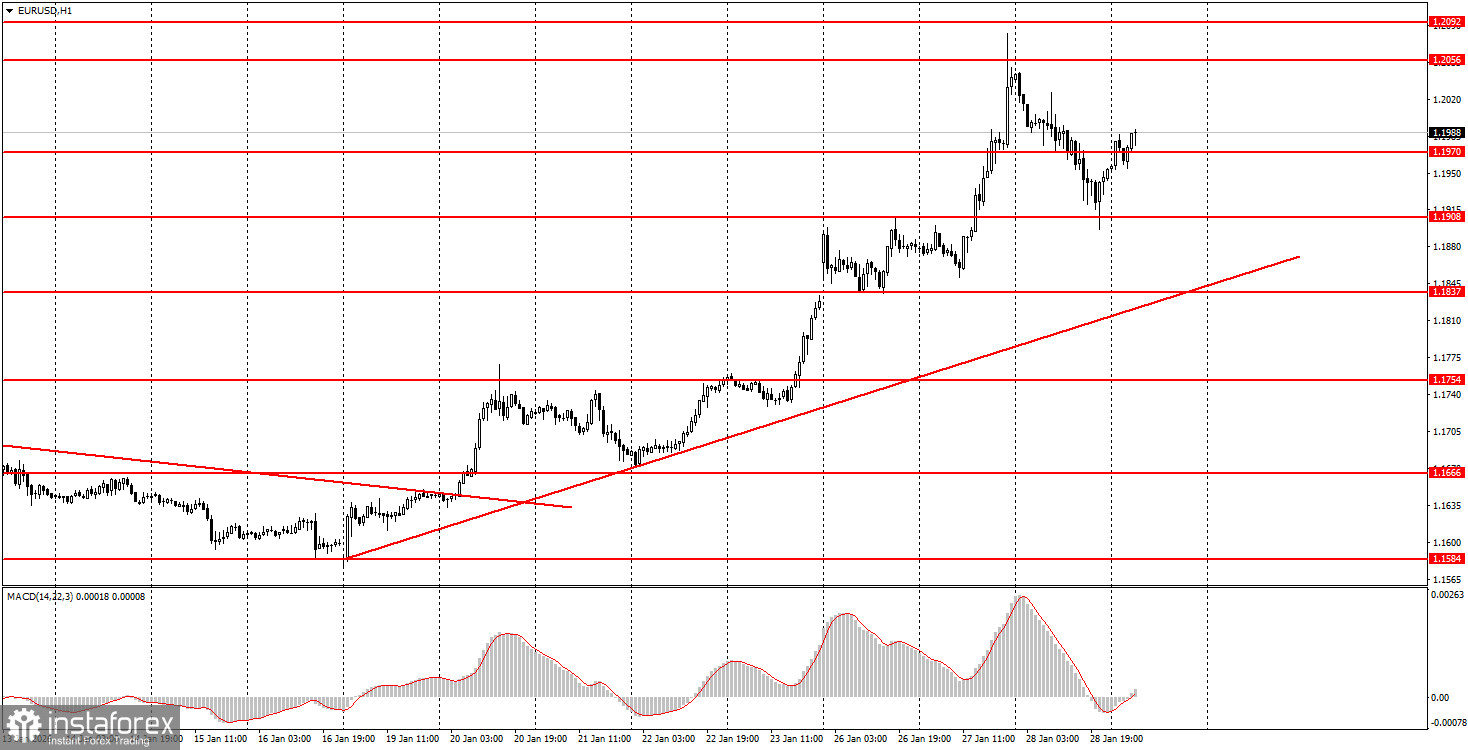
The EUR/USD currency pair traded lower throughout Wednesday, reaching 1.1908 by the end of the day, losing almost 150 pips. Since the pair had demonstrated strong growth up to Wednesday, a correction of 150 pips is quite proportional to the main movement. At this moment, it cannot be said that the upward trend supported by the trend line has ended. We saw a noticeable correction, but it does not affect the trend. The correction itself was not provoked by macroeconomic or fundamental events. Throughout the day yesterday, only one event could attract traders' attention – the FOMC meeting. Even this event was overshadowed by other developments related to Donald Trump. Thus, the Fed could not inherently provide strong support to the dollar. The key interest rate remained unchanged, as expected. Jerome Powell stated at the press conference that a new "shutdown" could not only harm the economy but also make further rate cuts impossible due to the lack of key economic data. Thus, Powell allowed for a rate cut in March, which is a more "dovish" outcome than expected.
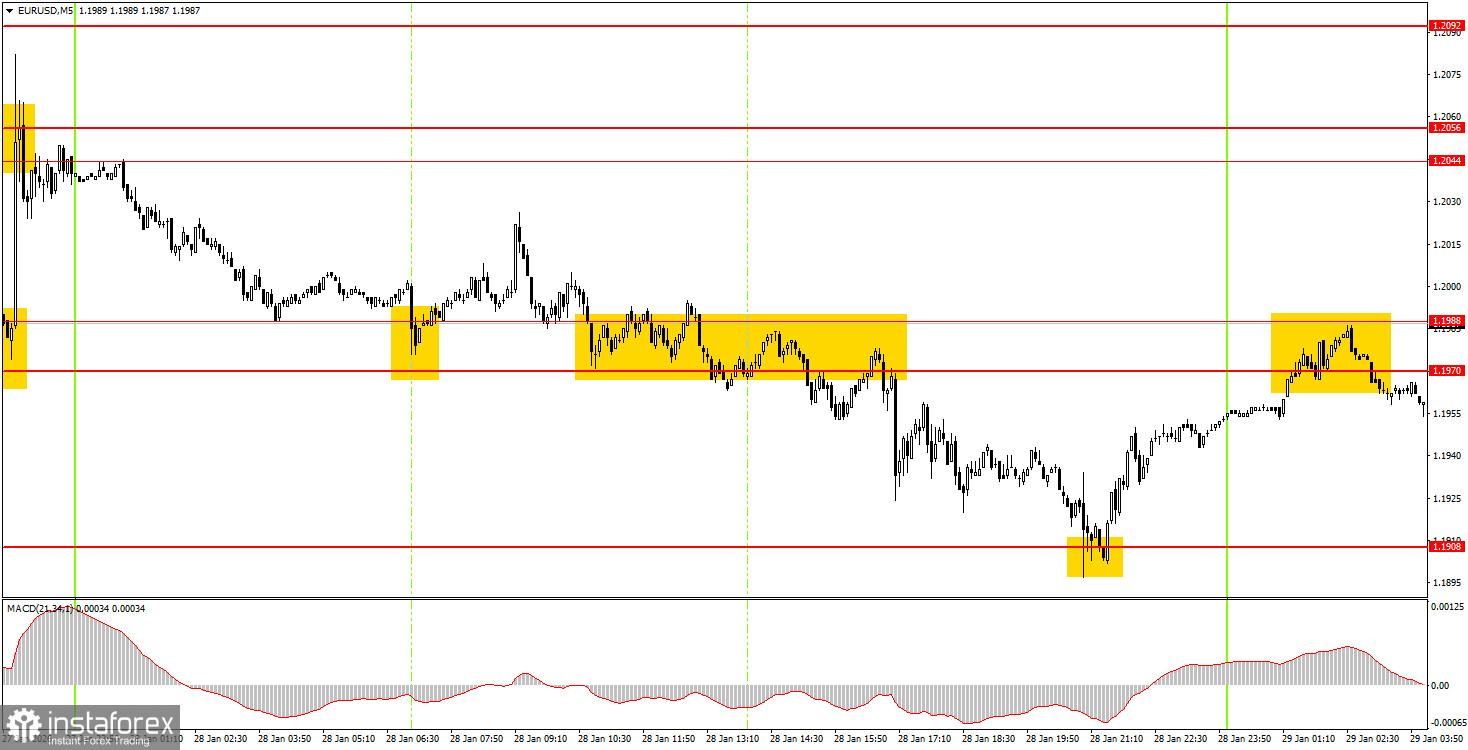
On the 5-minute timeframe, a considerable number of trading signals were formed on Wednesday. Initially, the price bounced off the 1.1970-1.1988 area, but this signal proved false and was closed at breakeven by the Stop Loss. Then a sell signal followed in the same area, and by evening, the target – the level of 1.1908 – was reached. A bounce from the 1.1908 level allowed the opening of long positions, and in this case, the target was also achieved. However, it was probably not advisable to enter the market immediately after the FOMC meeting.
The upward trend continues to form on the hourly timeframe. On Monday night, the price consolidated above the area of 1.1800-1.1830, above the range of 1.1400-1.1830, so the flat that lasted for 7 months can be considered complete. The overall fundamental and macroeconomic background remains very weak for the US dollar, so we fully support further growth of the euro currency.
On Thursday, novice traders may open new long positions if the area of 1.1970-1.1988 is overcome, with targets of 1.2044-1.2056 and 1.2092. A bounce from the area of 1.1970-1.1988 will allow for opening shorts with a target of 1.1908.
On the 5-minute timeframe, essential levels to consider are 1.1354-1.1363, 1.1413, 1.1455-1.1474, 1.1527-1.1531, 1.1550, 1.1584-1.1591, 1.1655-1.1666, 1.1745-1.1754, 1.1830-1.1837, 1.1908, 1.1970-1.1988, 1.2044-1.2056, 1.2092-1.2104. Today, no significant events are scheduled in either the Eurozone or the US, so trading will have to rely on technical factors.
Support and resistance price levels — levels that serve as targets when opening buys or sells. Take Profit can be placed near them.
Red lines — channels or trendlines that reflect the current tendency and show which direction is preferable to trade now.
MACD indicator (14,22,3) — histogram and signal line — an auxiliary indicator that can also be used as a source of signals.
Important speeches and reports (always listed in the news calendar) can strongly affect a currency pair's movement. Therefore, during their release, trading should be done with maximum caution, or positions should be closed, to avoid a sharp price reversal against the preceding move.
Beginner forex traders should remember that not every trade can be profitable. Developing a clear strategy and effective money management are the keys to long-term trading success.
*The market analysis posted here is meant to increase your awareness, but not to give instructions to make a trade.
InstaSpot analytical reviews will make you fully aware of market trends! Being an InstaSpot client, you are provided with a large number of free services for efficient trading.


