


Ons team heeft meer dan 7,000,000 handelaren!
Elke dag werken we samen om de handel te verbeteren. We behalen hoge resultaten en gaan verder.
Erkenning door miljoenen handelaren over de hele wereld is de beste waardering voor ons werk! U heeft uw keuze gemaakt en wij zullen er alles aan doen om aan uw verwachtingen te voldoen!
Wij zijn samen een geweldig team!
InstaSpot. Trots om voor je te werken!


Acteur, UFC 6-toernooikampioen en een echte held!
De man die zichzelf heeft gemaakt. De man die onze kant op gaat.
Het geheim achter het succes van Taktarov is een constante beweging naar het doel.
Onthul alle kanten van je talent!
Ontdekken, proberen, falen - maar nooit stoppen!
InstaSpot. Je succesverhaal begint hier!

On Tuesday, the euro declined by 42 pips. The downward movement paused at the 55-day moving average (MA55). Now, the test of the target support at 1.1495 — if the market decides to react to new guidance from the FOMC — is likely to occur via a sharp breakout, as it would need to overcome technical supports. If that happens, the next target would be 1.1380.
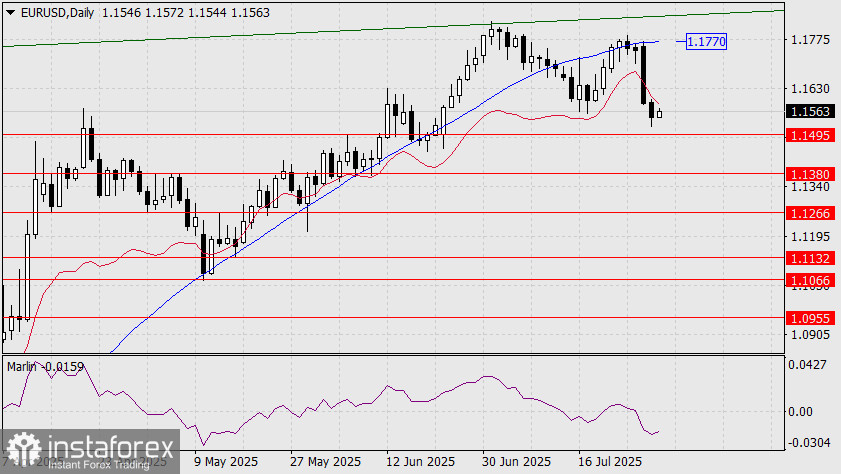
The current situation on the daily chart is bearish: the price is holding below the indicator lines, the MACD line has turned downward, and the Marlin oscillator is declining in the negative zone.
The only question is: how strong will the FOMC signal be regarding a possible rate cut in September? We believe it won't be particularly strong — possibly just one rate cut before the end of the year, without further changes in December.
This is due to inflation, which has started to rise again. Additionally, we observe the Federal Reserve's resistance to market-driven signals for rate cuts, particularly in relation to the yield curve. The FOMC is pursuing a deeper, more strategic agenda.
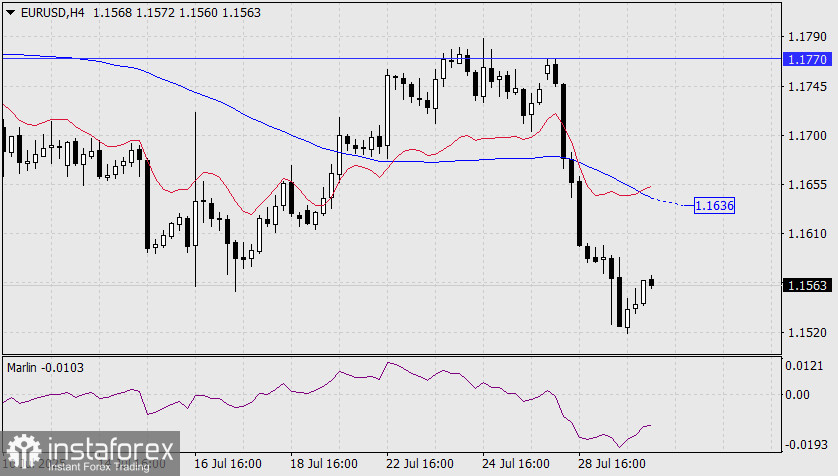
On the H4 chart, the picture is also fully bearish: the price is declining below downward-sloping indicator lines, and the Marlin oscillator has made a mild correction — a release of pressure to allow for a smoother continuation of the decline.
However, if the price breaks above the MACD line (1.1636), an attack on the daily MACD line at 1.1770 becomes possible. But that would be an alternative scenario.
*The market analysis posted here is meant to increase your awareness, but not to give instructions to make a trade.
InstaSpot analytical reviews will make you fully aware of market trends! Being an InstaSpot client, you are provided with a large number of free services for efficient trading.


