


The legend in the InstaSpot team!
Legend! You think that's bombastic rhetoric? But how should we call a man, who became the first Asian to win the junior world chess championship at 18 and who became the first Indian Grandmaster at 19? That was the start of a hard path to the World Champion title for Viswanathan Anand, the man who became a part of history of chess forever. Now one more legend in the InstaSpot team!


Borussia is one of the most titled football clubs in Germany, which has repeatedly proved to fans: the spirit of competition and leadership will certainly lead to success. Trade in the same way that sports professionals play the game: confidently and actively. Keep a "pass" from Borussia FC and be in the lead with InstaSpot!

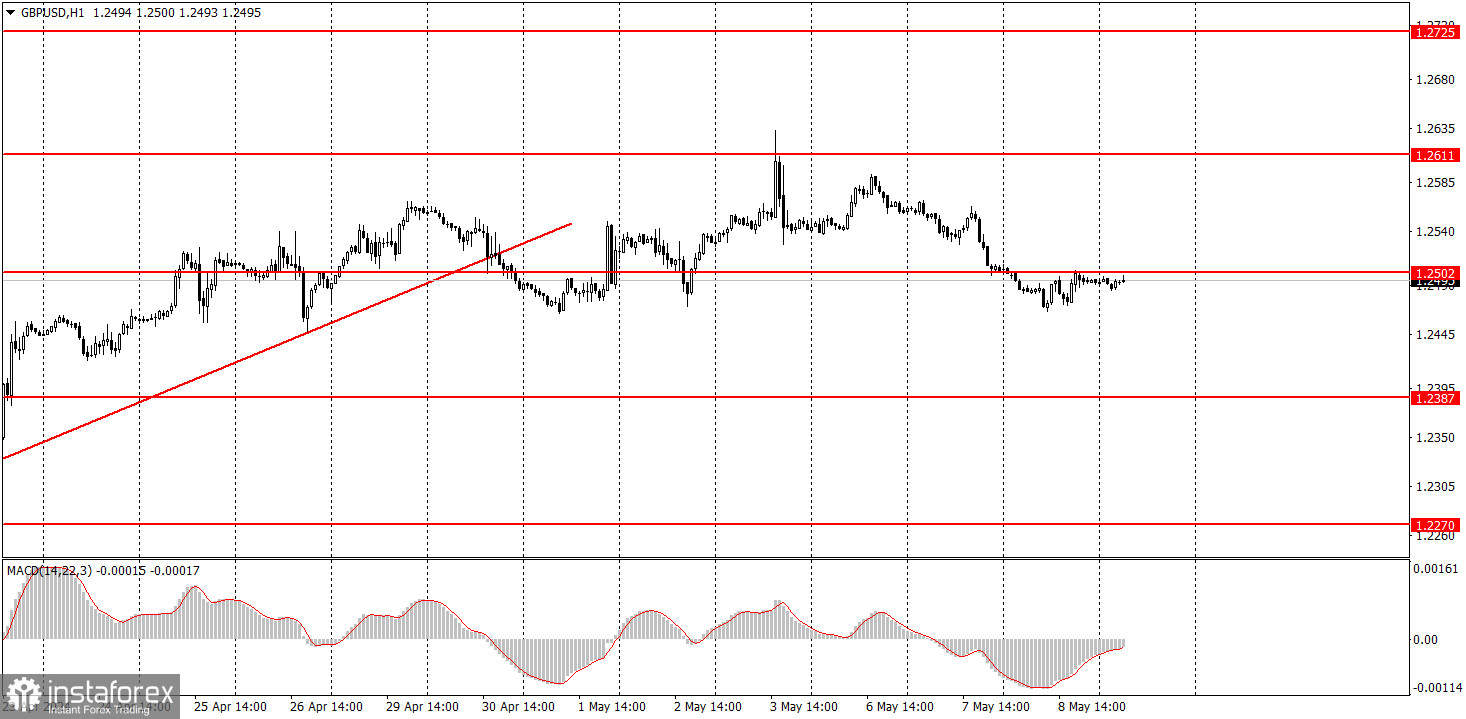
The GBP/USD pair traded flat throughout Wednesday. The day's volatility amounted to a mere 37 pips, which is absolutely low for the pound. There's nothing surprising about this. The absence of economic releases on Wednesday, and today's announcement of the Bank of England meeting and BoE Governor Andrew Bailey's speech contributes to the market's state of inactivity. Therefore, this is quite predictable. However, at the beginning of the week, it seemed that the market was expecting hawkish statements and decisions from the British central bank, leading to a bearish bias on the British currency. But yesterday, it was clear that the GBP/USD pair's declines on Monday and Tuesday were just market noise. The upward trend remained intact even after the price breached the trendline, and the recent decline did not even lead to a breakthrough of the last local low. Therefore, the pair could resume its upward movement at any moment, although it is still part of a correction.
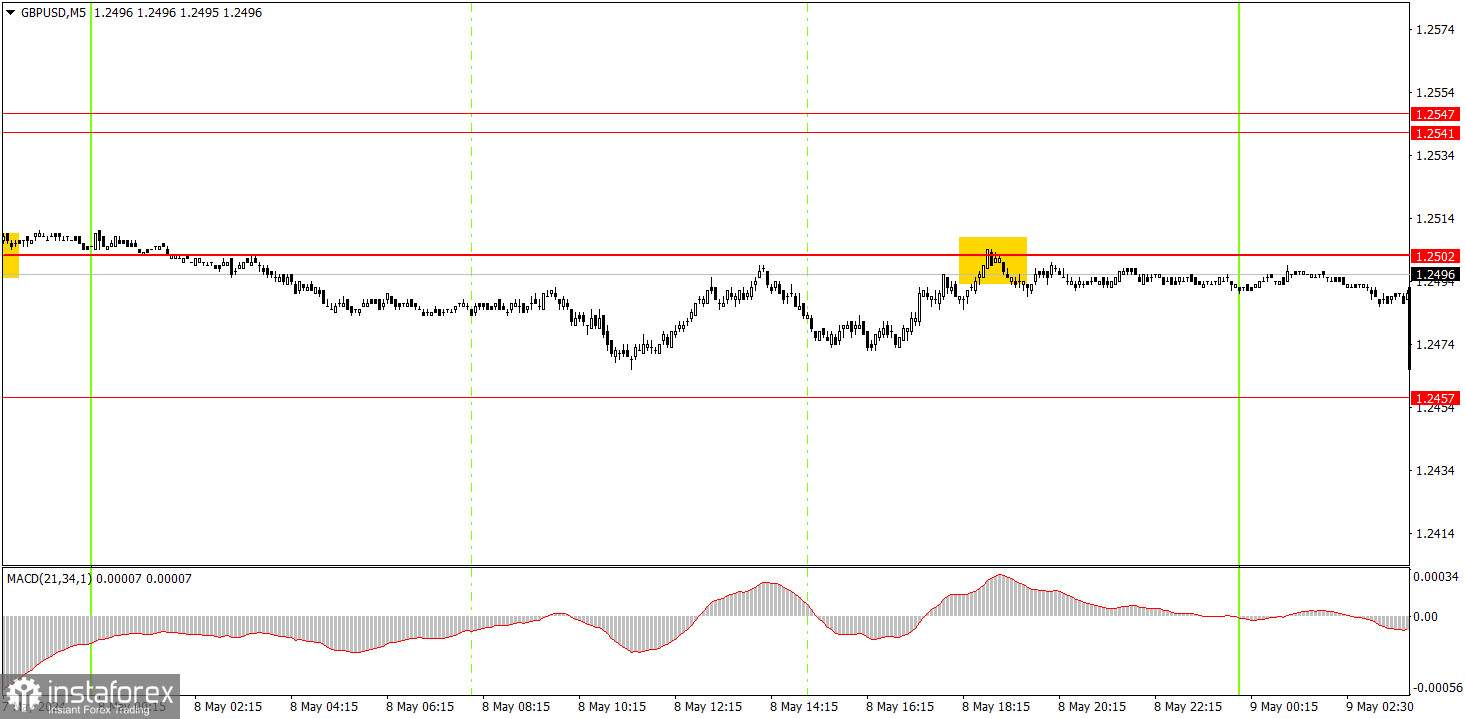
Only one trading signal was generated on the 5-minute timeframe. To be precise, by the end of the day, the pair tested the level of 1.2502, but it didn't even bounce from this mark. Therefore, traders could open a short position while aiming for an overnight decline, but as we saw in the morning, the pair was flat during the Asian session. Throughout the day, the pair also bounced off the level of 1.2502 with a small margin, so beginners could open short positions. However, this trade also resulted in neither profit nor loss.
On the hourly chart, the GBP/USD pair has excellent prospects for forming a downward trend, but the correction persists. The fundamental backdrop continues to support the dollar much more than the British pound. Therefore, we only expect downward movement from the pair. If the BoE does not disappoint the market with hawkish rhetoric and its decisions this week, the pound should start a downward movement.
Today, you may consider trading from the level of 1.2502, but the pound's movement will completely depend on the results of the BoE meeting. Therefore, it is important to approach this event very carefully and hedge all open trades in advance.
The key levels on the 5M chart are 1.2270, 1.2310, 1.2372-1.2387, 1.2457, 1.2502, 1.2541-1.2547, 1.2605-1.2611, 1.2648, 1.2691, 1.2725, 1.2787-1.2791. On Thursday, the US docket will only feature a secondary report on initial jobless claims. The key events of the day will be the results of the Monetary Policy Committee's vote on the interest rate, and Bailey's speech.
1) Signal strength is determined by the time taken for its formation (either a bounce or level breach). A shorter formation time indicates a stronger signal.
2) If two or more trades around a certain level are initiated based on false signals, subsequent signals from that level should be disregarded.
3) In a flat market, any currency pair can produce multiple false signals or none at all. In any case, the flat trend is not the best condition for trading.
4) Trading activities are confined between the onset of the European session and mid-way through the U.S. session, after which all open trades should be manually closed.
5) On the 30-minute timeframe, trades based on MACD signals are only advisable amidst substantial volatility and an established trend, confirmed either by a trendline or trend channel.
6) If two levels lie closely together (ranging from 5 to 15 pips apart), they should be considered as a support or resistance zone.
Support and Resistance price levels can serve as targets when buying or selling. You can place Take Profit levels near them.
Red lines represent channels or trend lines, depicting the current market trend and indicating the preferable trading direction.
The MACD(14,22,3) indicator, encompassing both the histogram and signal line, acts as an auxiliary tool and can also be used as a signal source.
Significant speeches and reports (always noted in the news calendar) can profoundly influence the price dynamics. Hence, trading during their release calls for heightened caution. It may be reasonable to exit the market to prevent abrupt price reversals against the prevailing trend.
Beginners should always remember that not every trade will yield profit. Establishing a clear strategy coupled with sound money management is the cornerstone of sustained trading success.
*The market analysis posted here is meant to increase your awareness, but not to give instructions to make a trade.
InstaSpot analytical reviews will make you fully aware of market trends! Being an InstaSpot client, you are provided with a large number of free services for efficient trading.


