


EUR/USD
Analysis:
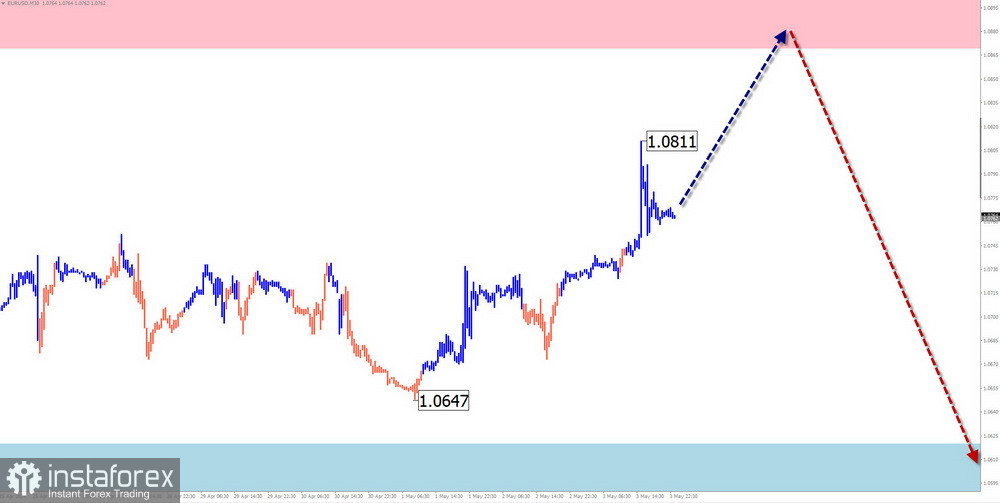
The weekly chart scale of the major European currency pair shows that the dominant descending wave of recent months is nearing completion. The wave structure appears to be formed. The unfinished segment in the upward direction dates back to April 16.
Forecast:
We expect to see a general sideways movement in the euro's price in the upcoming week. One should expect an increase towards the calculated resistance zone in the coming days. Subsequently, there is a high probability of transitioning into a drift, followed by a further price decline. The greatest volatility is expected towards the end of the week.
Potential reversal zones
Resistance:
Support:
Recommendations:
Buying: Small volume purchases within the "intraday" framework can be profitable for the deposit.
Selling: Without confirmed reversal signals near the resistance zone, conditions for such transactions do not exist.
USD/JPY
Analysis:
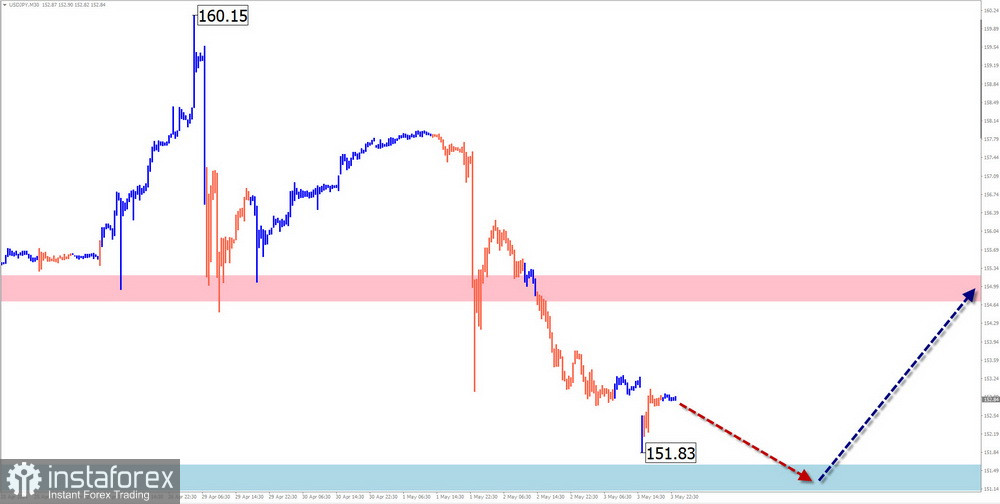
Over the past year, the dominant upward wave of the main Japanese yen pair has been completed. The descending wave zigzag initiated on April 29 possesses reversal potential. Its structure began forming the middle part (B) at the end of last week. Quotes reached the lower boundary of the potential reversal zone on the H4 timeframe.
Forecast:
At the beginning of the upcoming week, there is a high probability of price movement within the corridor between the nearest counter zones. A transition to sideways drift is expected after possible pressure on the support zone. Towards the end of the week, one can expect a resumption of price growth towards the resistance boundaries.
Potential reversal zones
Resistance:
Support:
Recommendations:
Selling: Carries increased risk and may lead to losses for your deposit. Refraining from trading until the upcoming upward correction is completed is optimal.
Buying: Becomes possible after the appearance of reversal signals from your trading systems near the resistance zone.
GBP/JPY
Analysis:
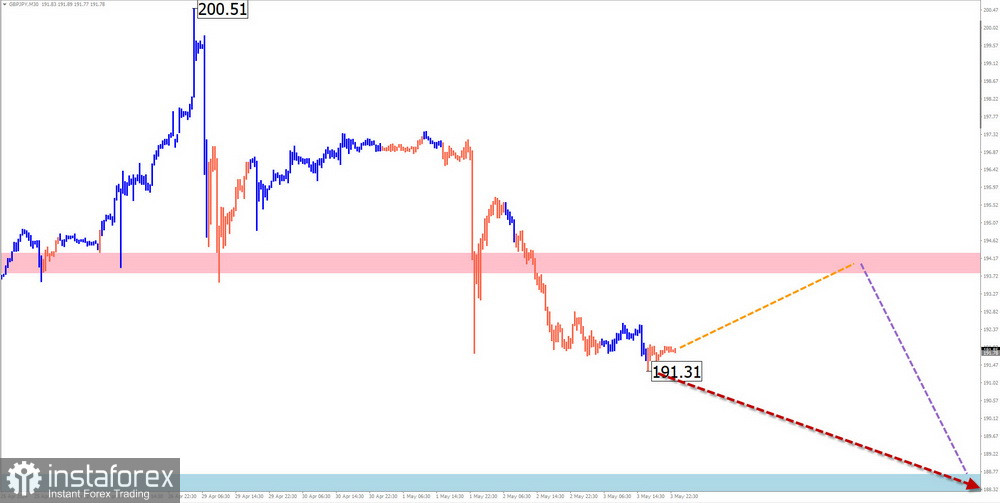
The direction of movement of the British pound/Japanese yen pair since the end of September 2022 is determined by an ascending wave. On the weekly timeframe, it completes a larger ascending wave structure. The descending segment since April 29 possesses reversal potential and may mark the beginning of a correction of the main wave.
Forecast:
In the coming days, the flat character of the movement is expected to continue. A short-term increase in quotes to the resistance zone is not excluded. In the following days, an increase in volatility, a reversal, and a resumption of price decline are expected. A brief breach of the upper resistance boundary is possible upon course change.
Potential reversal zones
Resistance:
Support:
Recommendations:
Buying: It is suggested that the main attention be devoted to finding buy signals near the support zone.
Selling: It may become risky and not recommended in the coming days.
USD/CAD
Analysis:
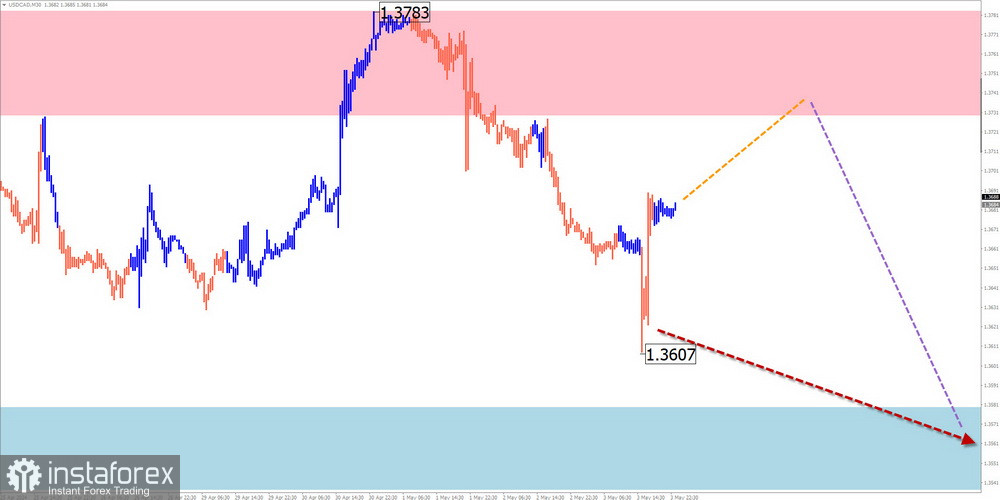
The direction of movement of the Canadian dollar in the main pair since the end of December last year is determined by an ascending wave. The price has reached the boundaries of the wide potential reversal zone in the weekly timeframe. Since the middle of last month, pair quotes have predominantly moved sideways, forming a correction. The wave structure needs to be completed.
Forecast:
The most probable scenario for price movement in the coming days will be a gradual shifting sideways between the nearest counter zones. After a bounce in price towards the upper boundary of the channel, a decline in quotes towards the support area is expected.
Potential reversal zones
Resistance:
Support:
Recommendations:
Buying: High risk and may lead to losses.
Selling: Fractional volumes may be used within individual trading sessions.
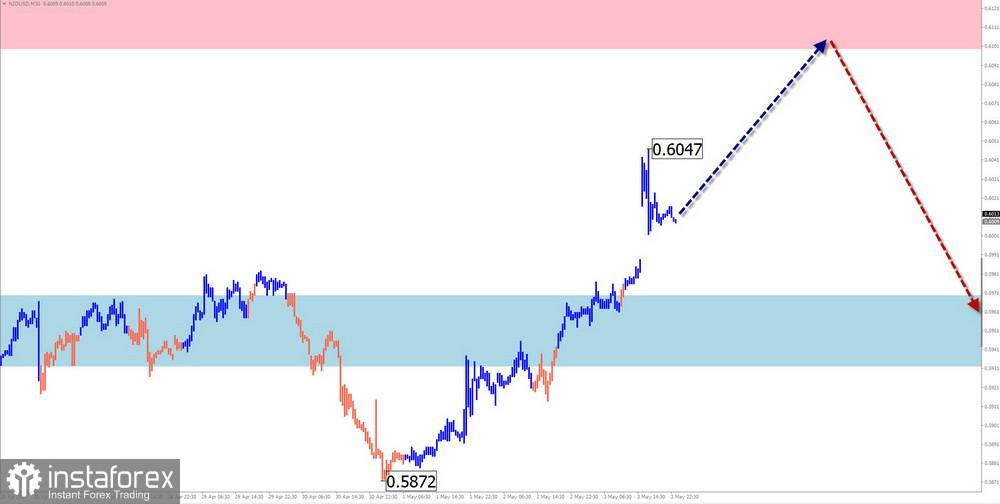
NZD/USD
Brief analysis:
The unfinished wave structure of the New Zealand dollar chart is directed southward. It dates back to the end of December last year. The middle part (B) continues to form within the wave structure, resembling a horizontal plane. The resistance boundary runs along the lower boundary of a strong potential reversal zone of the large timeframe.
Weekly forecast:
During the upcoming week, gradual movement towards the resistance zone is expected. After reaching the calculated resistance zone, there is a high probability of a downward correction to the support zone.
Potential reversal zones
Resistance:
Support:
Recommendations:
Buying: Has limited potential and may be used for scalping.
Selling: After confirmed reversal signals appear near the support zone, it may become the main direction for trading this pair.
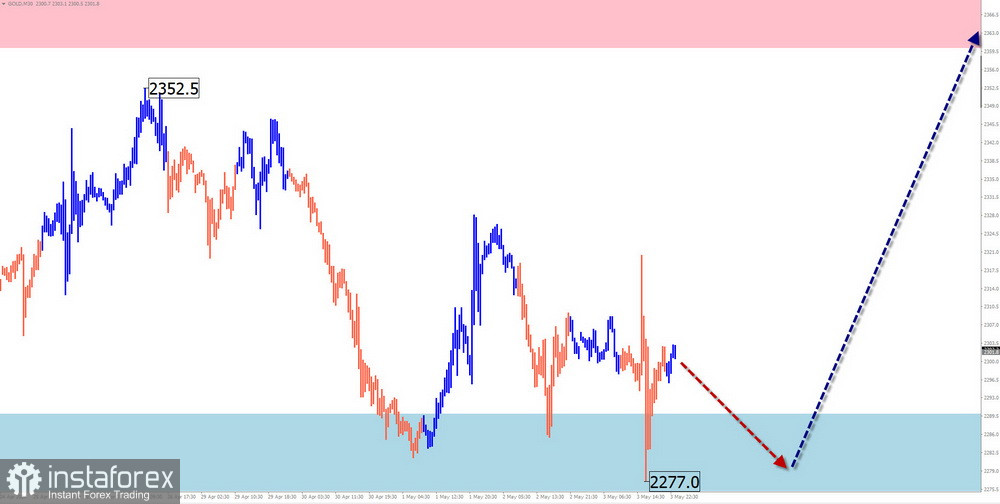
Gold
Analysis:
In the gold chart, the direction of short-term trends over the past year is determined by an ascending wave algorithm. Since mid-April, the wave has been correcting, forming an elongated plane. At the time of analysis, it does not appear complete, moving sideways flat along the calculated support zone.
Forecast:
In the coming days, the pair's price should complete the movement's correction phase. A subsequent reversal and price increase towards the resistance zone can be expected by the end of the upcoming week. Breaking out of the indicated price corridor is possible but unlikely.
Potential reversal zones
Resistance:
Support:
Recommendations:
Buying: Becomes possible after suitable signals appear near the support zone.
Selling: Conditions for such transactions will arise after confirmed signals appear near the resistance zone.
Note: In simplified wave analysis (SWA), all waves consist of 3 parts (A-B-C). The latest, unfinished wave is analyzed for each timeframe. Dashed lines indicate expected movements.
Attention: The wave algorithm does not consider the duration of instrument movements over time!
*The market analysis posted here is meant to increase your awareness, but not to give instructions to make a trade.
InstaSpot analytical reviews will make you fully aware of market trends! Being an InstaSpot client, you are provided with a large number of free services for efficient trading.


