


To open long positions on EUR/USD, the following is required:
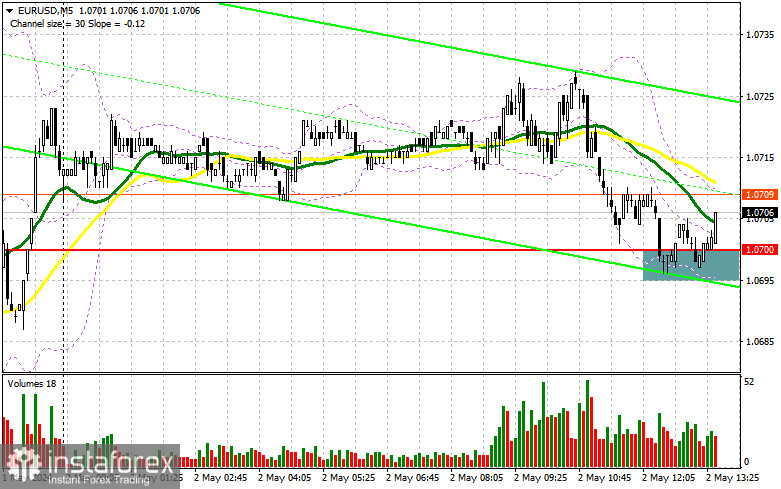
The data on manufacturing activity in Germany and other eurozone countries released in the first half of the day managed to please traders. However, a less significant contraction is not much reason for joy. But this allowed the euro to stay above 1.0700, which buyers can use in the second half of the day. However, much will depend on the statistics on initial jobless claims, the balance of trade, and changes in labor productivity in the non-manufacturing sector of the US. Strong indicators will lead to another decline and a test of the 1.0700 level, for which hopes are already quite low. Only the formation of a false breakout there, similar to what I discussed earlier, will provide an entry point into long positions, capable of pushing the euro again towards the significant resistance at 1.0751 formed at the end of last week. A breakout and a new downward update of this range will lead to a new bullish market and a buy signal with a chance to surge to 1.0779. The ultimate target will be the maximum at 1.0804, where I will take a profit. In the event of a decline in EUR/USD and the absence of activity around 1.0700, which is much more likely, pressure on the euro within the medium-term bearish trend will return. In this case, I will enter the market only after a false breakout is formed around the next support at 1.0653. I plan to open long positions immediately on the rebound from 1.0601 with a target of a 30-35 point upward correction within the day.
To open short positions on EUR/USD, the following is required:
Euro sellers have every chance of pushing the pair down, but they need to break through 1.0700 to do this. If the US data turns out too weak, I would like to see sellers' activity around the significant resistance at 1.0751, which we did not reach in the first half of the day. Forming a false breakout would be an excellent scenario for entering short positions with a target of a decline to around 1.0700 - the support tested in the first half of the day, where the moving averages are located, playing in favor of buyers. A breakout and consolidation below this range and a reverse test from bottom to top will provide another selling point, with the pair moving towards 1.0653. There, I expect more active participation from large buyers. The ultimate target will be the minimum at 1.0601, where I will take a profit. In the event of upward movement of EUR/USD in the second half of the day and the absence of bears at 1.0751, bears will bid farewell in hopes of regaining market control. In this case, I will postpone sales until the next resistance test at 1.0779. I will also sell there, but only after an unsuccessful consolidation. I plan to open short positions immediately on the rebound from 1.0804 with a 30-35 point downward correction target.
.
Indicator Signals:
Moving Averages
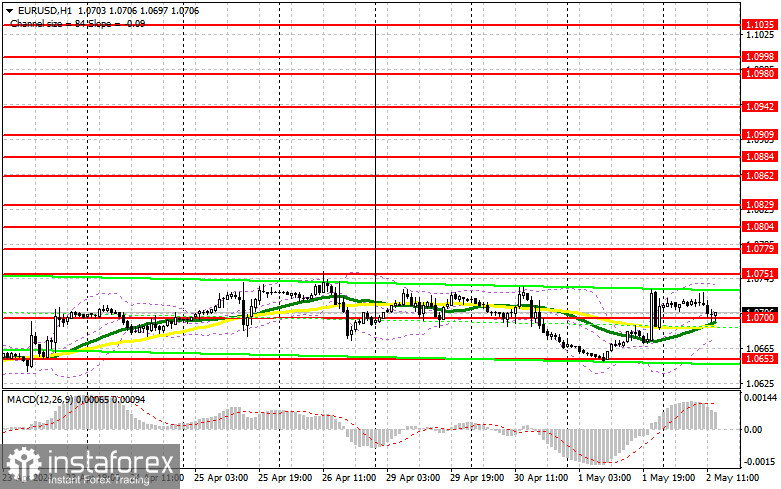
Trading is carried out around the 30 and 50-day moving averages, indicating a sideways market.
Note: The author considers the period and prices of moving averages on the hourly chart H1, which differs from the general definition of classic daily moving averages on the daily chart D1.
Bollinger Bands
In case of a decline, the lower boundary of the indicator, around 1.0665, will act as support.
Description of Indicators:
*The market analysis posted here is meant to increase your awareness, but not to give instructions to make a trade.
InstaSpot analytical reviews will make you fully aware of market trends! Being an InstaSpot client, you are provided with a large number of free services for efficient trading.


