



InstaSpot टीम में लीजेंड!
लीजेंड! आपको लगता है कि धमाकेदार बयानबाजी है? लेकिन हमें एक आदमी को कैसे बुलाना चाहिए, जो 18 साल की जूनियर विश्व शतरंज चैंपियनशिप जीतने वाला पहला एशियाई बना और 19 में पहला भारतीय ग्रैंडमास्टर कौन बना? यह विश्वनाथन आनंद के लिए विश्व चैंपियन खिताब के लिए एक कठिन मार्ग की शुरुआत थी, जो उस व्यक्ति के लिए हमेशा के लिए शतरंज का इतिहास बन गया। अब InstaSpot टीम में एक और लीजेंड!



बोरूसिया जर्मनी में सबसे अधिक शीर्षक वाले फुटबॉल क्लबों में से एक है, जो प्रशंसकों के लिए बार-बार साबित हुआ है: प्रतियोगिता और नेतृत्व की भावना निश्चित रूप से सफलता की ओर ले जाएगी। उसी तरह से व्यापार जिसमें खेल पेशेवर खेल खेलते हैं: आत्मविश्वास से और सक्रिय रूप से। बोरूसिया FC से एक "पास" रखें और InstaSpot के साथ नेतृत्व में रहें!

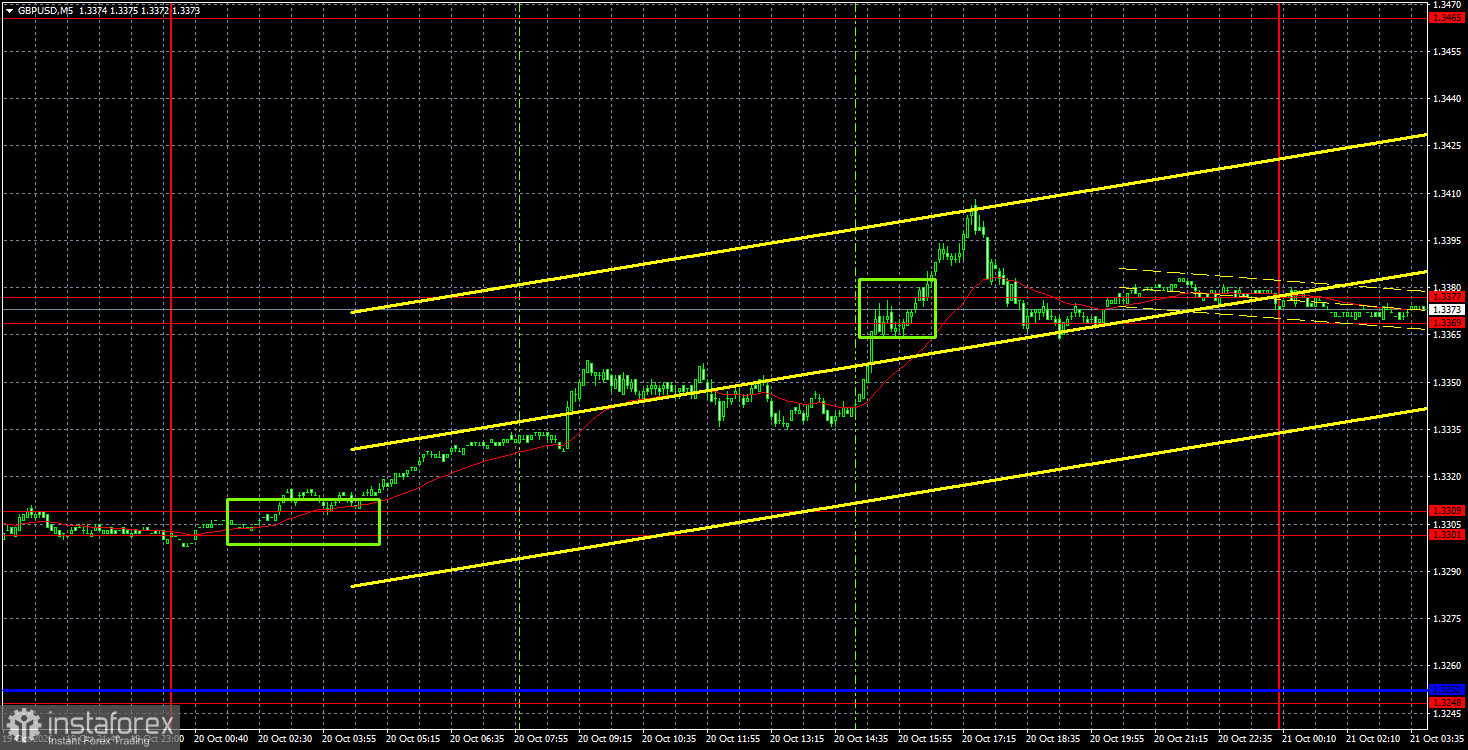
The GBP/USD pair resumed its upward move on Tuesday after a positive UK unemployment report. The unemployment rate unexpectedly fell from 4.9% to 4.7% in August, which the market naturally noted. As a result, sterling spent almost the entire day in an uptrend — a logical move even without the labor-market print. Recall that technicals are the primary driver for the pound right now. After price bounced and removed liquidity at the lower edges of two sideways channels on the daily and weekly timeframes, any rally in the pound was to be expected. Today's inflation report, due in a few hours, could create headwinds for sterling, but it is unlikely CPI will slow materially or the Bank of England will abandon plans to tighten policy. Because the market has not yet fully priced in that tightening, we still expect GBP/USD to rise.
Technically, the pound has moved not only toward a correction but also toward a stronger, more durable uptrend. Given the valid sideways channels on the daily and weekly charts, it is reasonable to expect price to move toward the upper boundaries after bouncing from the lower edges.
On the 5-minute chart, Tuesday produced two solid buy signals. Overnight, price bounced from the 1.3301–1.3309 area and, by the European open, was only about 9 pips from the signal entry, so traders could have gone long. Early in the US session, price cleared the 1.3369–1.3377 zone, supporting long positions. Longs can still be held at this time.
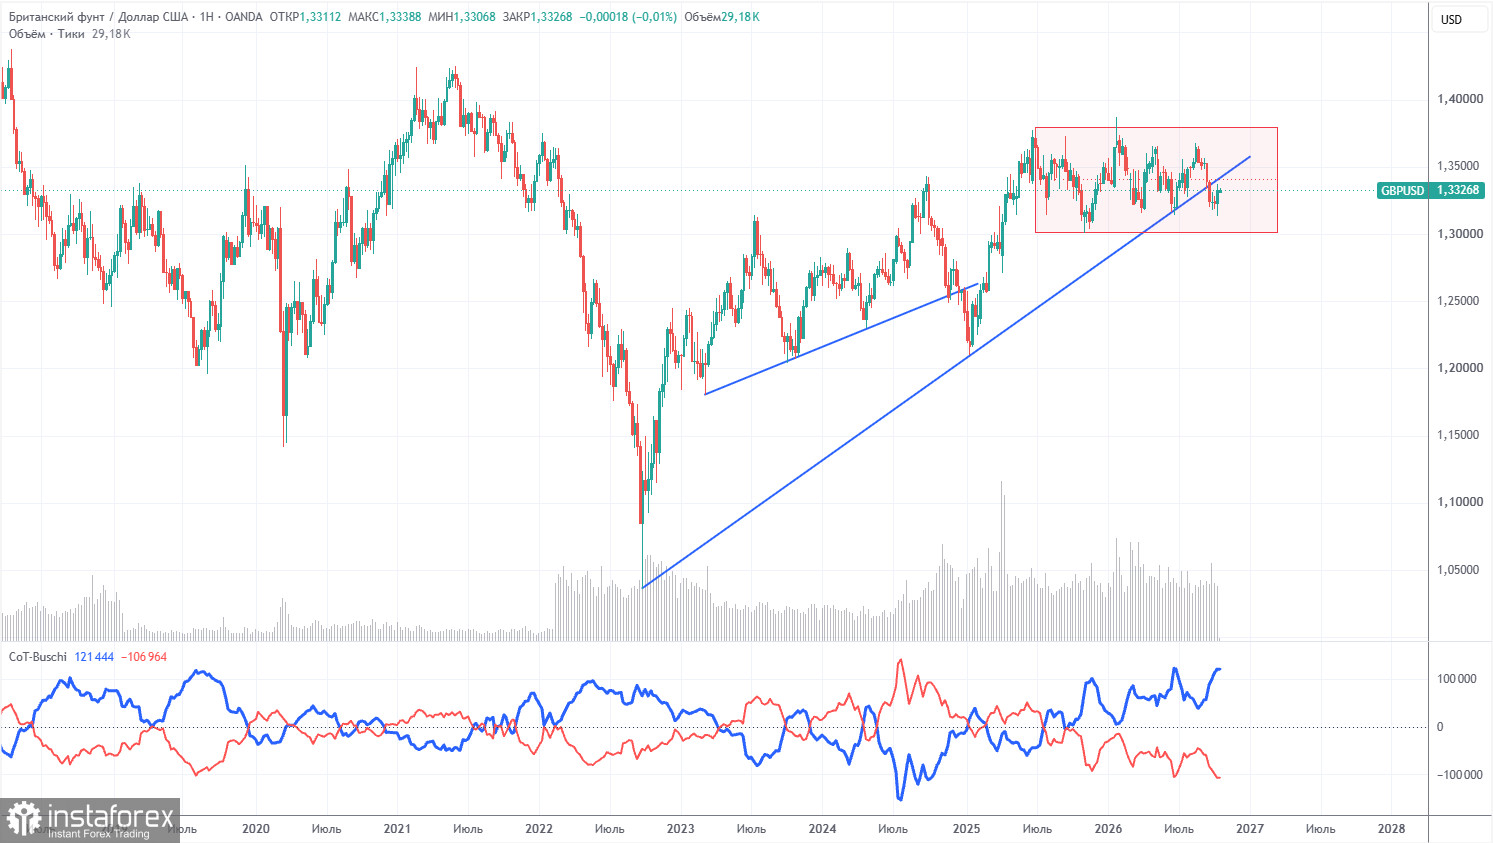
COT reports for the pound show non-commercial traders have been net sellers for several months. The net position is negative despite the persistent long-term uptrend. Given events in the Middle East, it is unsurprising that dollar demand has remained relatively strong in 2026. The US–Iran conflict is formally paused but not resolved. The Federal Reserve's shifting policy stance also supports the dollar, and the ascending trend line has been breached — but that breach occurred within a flat, so we do not view the long-term uptrend as finished.
Over the long run, the dollar continues to weaken under Donald Trump-associated policies, as shown on the weekly chart. The trade war will continue in one form or another, and Trump's policies weaken the US currency both directly and indirectly. The long-term uptrend remains intact. According to the latest COT report (October 13), the "Non-commercial" group closed 1,100 contracts and opened 8,300 SELL contracts — a net reduction of 9,400 contracts in the group's net position over the week.
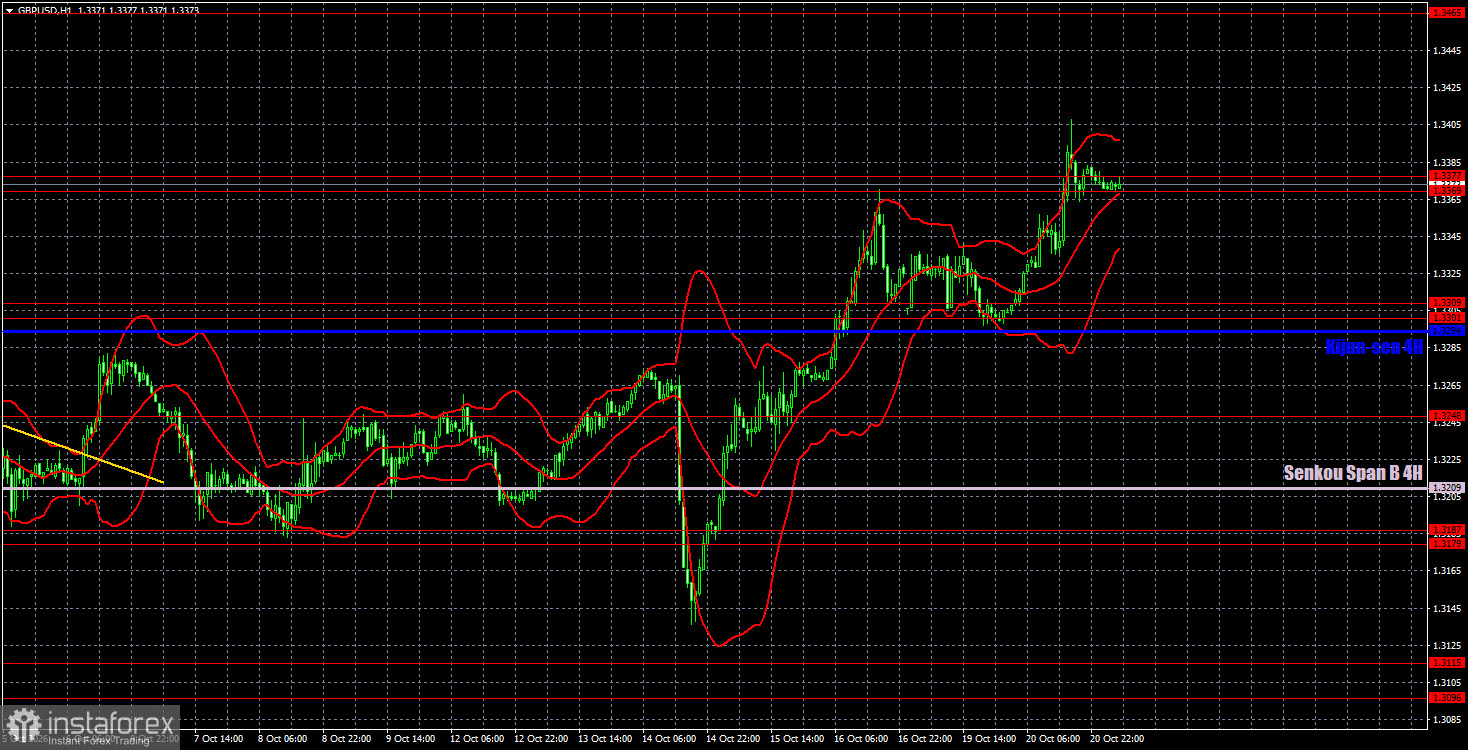
On the hourly timeframe, GBP/USD has begun forming a logical and orderly uptrend. On the daily and weekly timeframes, price cleared liquidity at prior lows and remains inside sideways channels. Therefore, sterling can be expected to rise at least to 1.3650, the upper boundary of the sideways channel on the daily chart. The reasons for the pound's rise are no more compelling than those for the dollar's rise over the past month.
For October 21 we highlight these trading levels: 1.3042–1.3050, 1.3096–1.3115, 1.3179–1.3187, 1.3248, 1.3301–1.3309, 1.3369–1.3377, 1.3465–1.3480, 1.3588, 1.3671–1.3681. Senkou Span B (1.3209) and Kijun-sen (1.3294) may also provide signals. Move stop-loss to breakeven after price moves 20 pips in the intended direction. Ichimoku lines can shift during the day and should be considered when defining signals.
Today the UK publishes its inflation report — the most important (and effectively the only) event of the day. The level of UK inflation will determine how quickly the Bank of England moves to tighten policy. We think a rate hike at the next meeting is likely, and higher-than-expected September CPI would strengthen the hawkish case. For the pound, higher inflation is positive.
Traders may consider 1.3294–1.3309 as a target for short positions if price closes below 1.3369–1.3377. A bounce off 1.3369–1.3377 would allow consideration of 1.3465–1.3480 as targets for longs.
*यहां पर लिखा गया बाजार विश्लेषण आपकी जागरूकता बढ़ाने के लिए किया है, लेकिन व्यापार करने के लिए निर्देश देने के लिए नहीं |
InstaSpot analytical reviews will make you fully aware of market trends! Being an InstaSpot client, you are provided with a large number of free services for efficient trading.


