




हमारी टीम के पास 7,000,000 से अधिक ट्रेडर हैं!
प्रतिदिन हम ट्रेडिंग को बेहतर बनाने के लिए एक साथ काम करते हैं। हम उच्च परिणाम प्राप्त कर रहे हैं और आगे की ओर बढ़ रहे हैं।
दुनियाभर के लाखों लोगों द्वारा हमारे काम को पहचानना, हमारे काम की सबसे अच्छी सराहना है! आपने आपनी पसंद बनाई है और हम आपकी अपेक्षाओं को पूरा करने के लिए हर संभव प्रयास करेंगे!
हम एक साथ एक अच्छी टीम हैं!
इंस्टाफॉरेक्स को इस बात का गर्व है कि वह आपके लिए काम कर रहा है!





एक्टर, यूएफसी 6 टूर्नामेंट का विजेता और एक सच्चा हीरो!
वह आदमी, जिसने अपनी मेहनत से सब किया है। वह आदमी, जो हमारे रास्तों पर चलता है.
टैक्टारोव की सफलता का राज लक्ष्य की ओर लगातर अग्रसर रहना है।
अपनी प्रतिभा के सभी पक्षों को प्रकट करें!
खोज करें, कोशिश करें, विफल हो-लेकिन कभी न रूकें!
इंस्टाफॉरेक्स- हमारी सफलताओं की कहानी यहाँ से शुरू होती है!

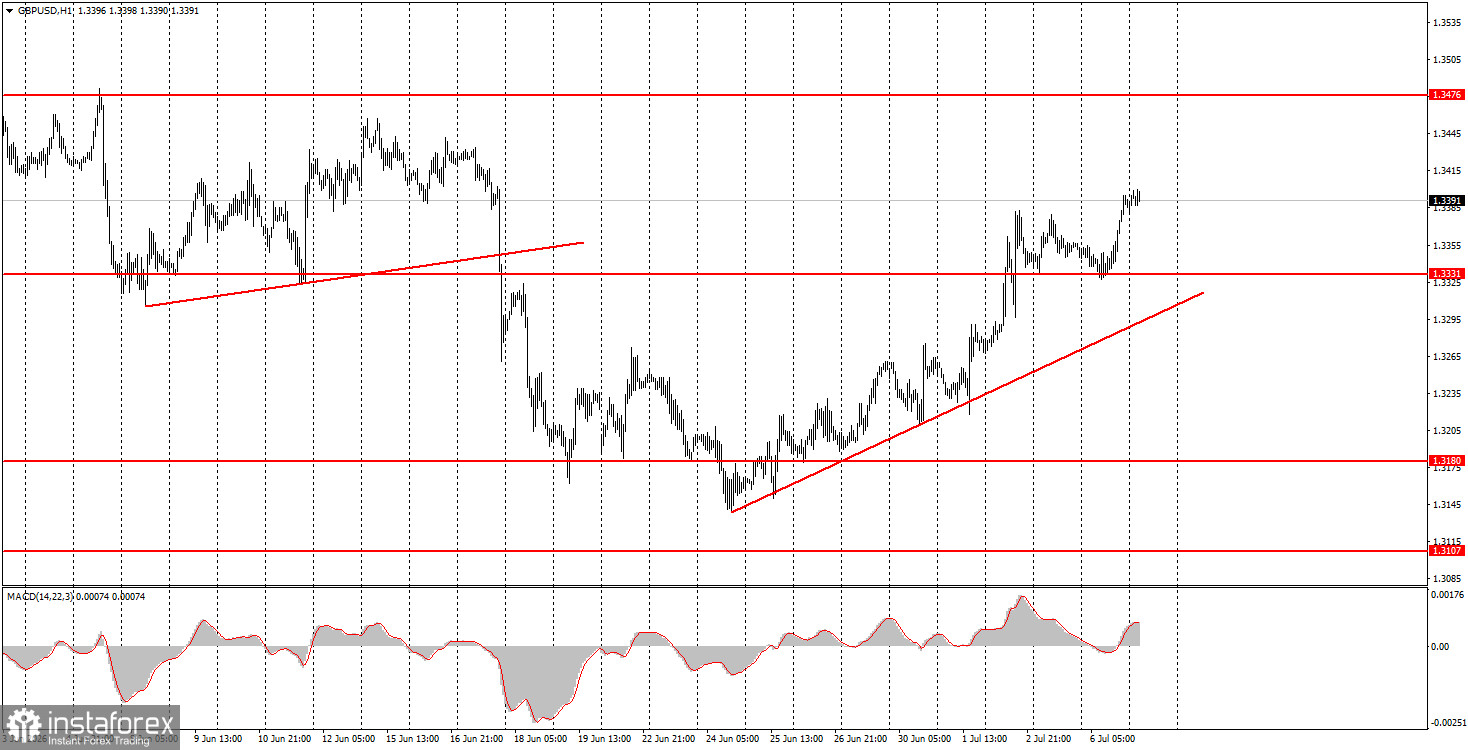
The GBP/USD pair continued its upward movement on Monday, even though there were no local grounds for this. However, as we noted before, the British pound has been falling completely illogically and baselessly in recent weeks. Therefore, we expect its recovery and suggest that growth will continue toward the 1.3600-1.3700 levels. Yesterday, the ISM Services PMI report was published in the U.S., and it did not evoke any significant reaction from traders. The actual value matched the forecast, resulting in no market reaction. Over the last two weeks, the pound sterling has managed to offset all losses incurred after the Federal Reserve meeting, where the market believed that the American central bank would definitely raise the key rate by the end of the year. We still have doubts about that, and the U.S. dollar has already exhausted all its growth factors in 2026. And there were only a few initially. If it weren't for the war in the Middle East, the GBP/USD pair would likely be trading above 1.4000 by now. However, geopolitics have introduced adjustments that have not impacted the long-term picture in the market. On the weekly timeframe, it is clear that the pair has been in an upward trend since 2022.
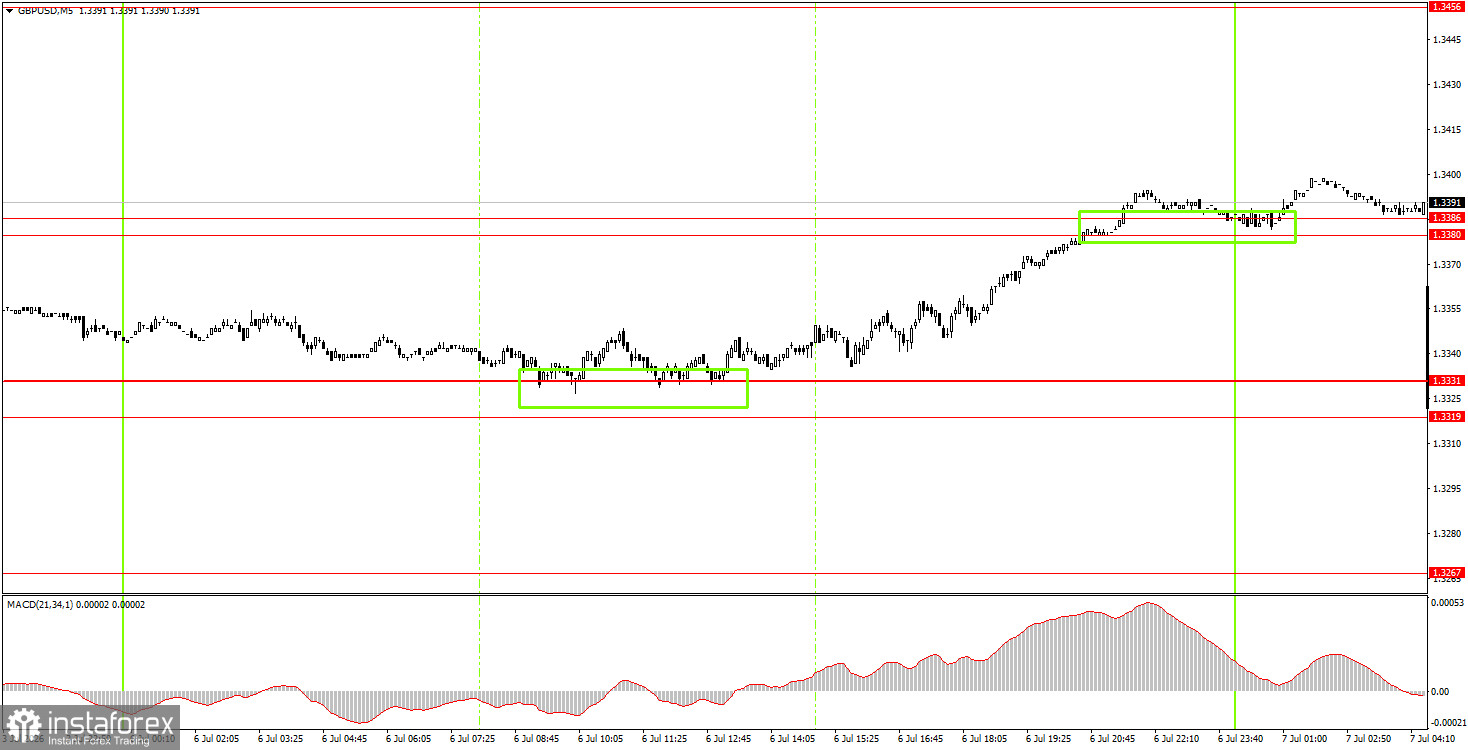
In the 5-minute timeframe, two strong buy signals were generated on Monday that novice traders could easily capitalize on. During the European trading session, the price bounced several times from the 1.3319-1.3331 area, and during the American session, it rose to the 1.3380-1.3386 area and broke through it. Thus, upward movement might continue today, and novice traders could have secured a profit of 45 pips yesterday.
On the hourly timeframe, the GBP/USD pair continues to form an upward trend that remains corrective but may become a full trend. The conflict in the Middle East is either not fully resolved or on pause, and the Fed has only signaled a possible rate hike by the end of the year, which may not materialize. We believe that the dollar no longer has grounds for growth—neither fundamentally nor geopolitically. Therefore, the rise of the British pound may continue.
On Tuesday, novice traders may consider short positions if the price consolidates below the 1.3380-1.3386 area, targeting 1.3319-1.3331. A consolidation above the 1.3380-1.3386 area allows maintenance of long positions targeting 1.3456-1.3476.
On the 5-minute timeframe, trading can currently occur at the following levels: 1.3043, 1.3096-1.3107, 1.3175-1.3180, 1.3259-1.3267, 1.3319-1.3331, 1.3380-1.3386, 1.3456-1.3476, 1.3587-1.3598, 1.3631-1.3641, and 1.3695. On Tuesday, there are no significant events scheduled in the UK, while the U.S. will release a weekly ADP labor market report, which does not evoke much interest.
Price levels (areas) of support and resistance are targets when opening long or short positions or sources of signals.
Red lines indicate channels or trend lines that display the current trend and indicate the preferred direction for trading.
The MACD indicator (14,22,3) – histogram and signal line – is a supplementary indicator that can also be used as a source of signals.
Important speeches and reports (contained in the news calendar) can significantly impact the movement of the currency pair. Therefore, during their release, trading should be conducted with maximum caution, or one should exit the market to avoid sharp reversals against preceding movements.
Beginners trading in the forex market should remember that not every trade can be profitable. Developing a clear strategy and practicing money management are key to long-term success in trading.
*यहां पर लिखा गया बाजार विश्लेषण आपकी जागरूकता बढ़ाने के लिए किया है, लेकिन व्यापार करने के लिए निर्देश देने के लिए नहीं |
InstaSpot analytical reviews will make you fully aware of market trends! Being an InstaSpot client, you are provided with a large number of free services for efficient trading.


