


हमारी टीम के पास 7,000,000 से अधिक ट्रेडर हैं!
प्रतिदिन हम ट्रेडिंग को बेहतर बनाने के लिए एक साथ काम करते हैं। हम उच्च परिणाम प्राप्त कर रहे हैं और आगे की ओर बढ़ रहे हैं।
दुनियाभर के लाखों लोगों द्वारा हमारे काम को पहचानना, हमारे काम की सबसे अच्छी सराहना है! आपने आपनी पसंद बनाई है और हम आपकी अपेक्षाओं को पूरा करने के लिए हर संभव प्रयास करेंगे!
हम एक साथ एक अच्छी टीम हैं!
इंस्टाफॉरेक्स को इस बात का गर्व है कि वह आपके लिए काम कर रहा है!


एक्टर, यूएफसी 6 टूर्नामेंट का विजेता और एक सच्चा हीरो!
वह आदमी, जिसने अपनी मेहनत से सब किया है। वह आदमी, जो हमारे रास्तों पर चलता है.
टैक्टारोव की सफलता का राज लक्ष्य की ओर लगातर अग्रसर रहना है।
अपनी प्रतिभा के सभी पक्षों को प्रकट करें!
खोज करें, कोशिश करें, विफल हो-लेकिन कभी न रूकें!
इंस्टाफॉरेक्स- हमारी सफलताओं की कहानी यहाँ से शुरू होती है!

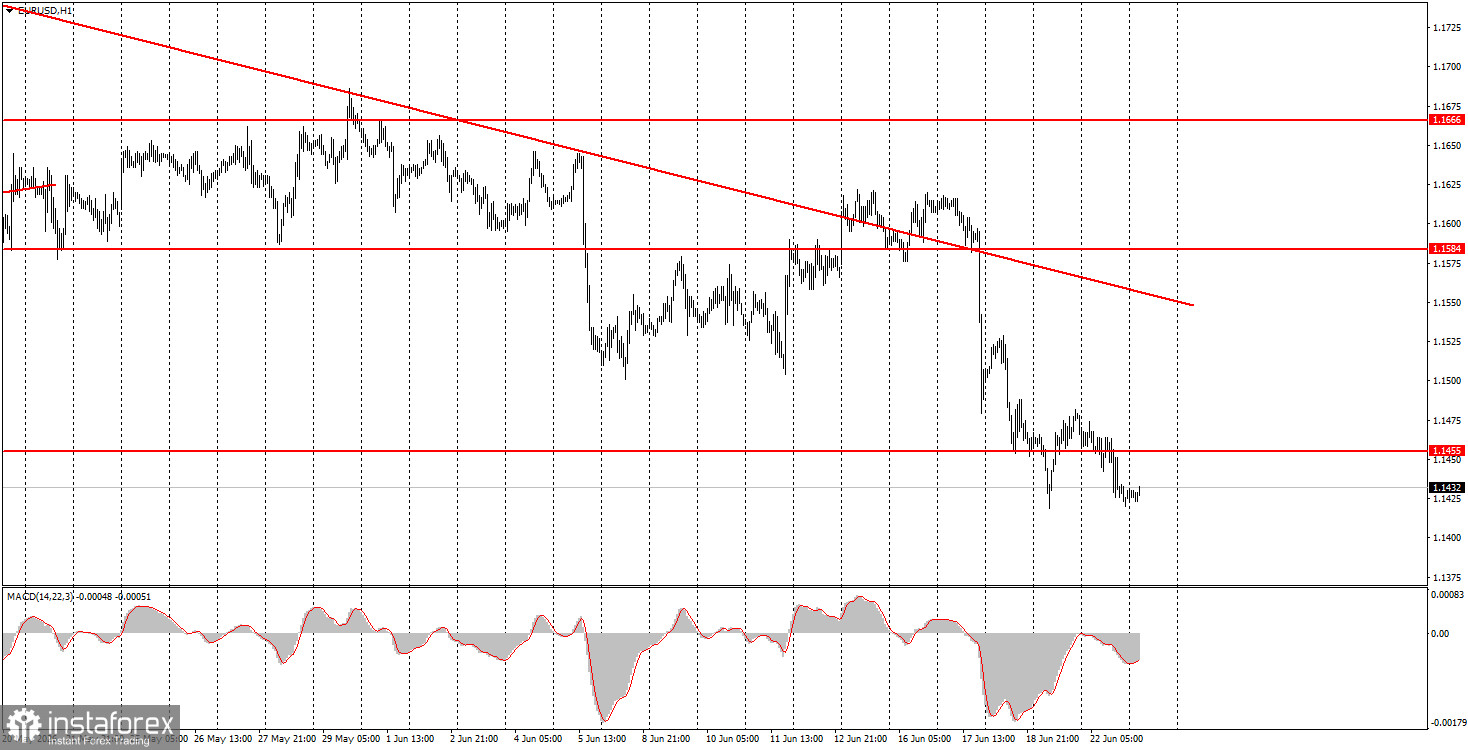
The EUR/USD currency pair leaned downward again during trading on Monday. What triggered the decline of the European currency this time? First, it is important to note that the fall of the euro was not strong, and the volatility of the pair throughout the day was high. However, after a significant decline last week due to rather dubious and contradictory reasons, the euro has so far failed to show any correction. This means the market remains inclined towards selling, despite everything. On Monday, it became known that the first round of new negotiations between Iran and the U.S. took place in Switzerland, but the results cannot be definitively labeled as positive. The U.S. lifted sanctions on the export of Iranian oil, unfroze some Iranian assets, and discussed a plan for further negotiations, as well as a plan for Iran's reconstruction. It seems like everything is positive, but on the same day, Donald Trump again threatened Iran with new strikes if a nuclear deal is not reached. Additionally, Tehran announced on Sunday that it was closing the Strait of Hormuz because the U.S. and Israel failed to uphold the truce due to the latter's attacks on Lebanon. Currently, it is unclear whether the Strait of Hormuz is open or closed. Thus, it is not possible to definitively call the negotiations in Switzerland positive. But it is better than a new war.
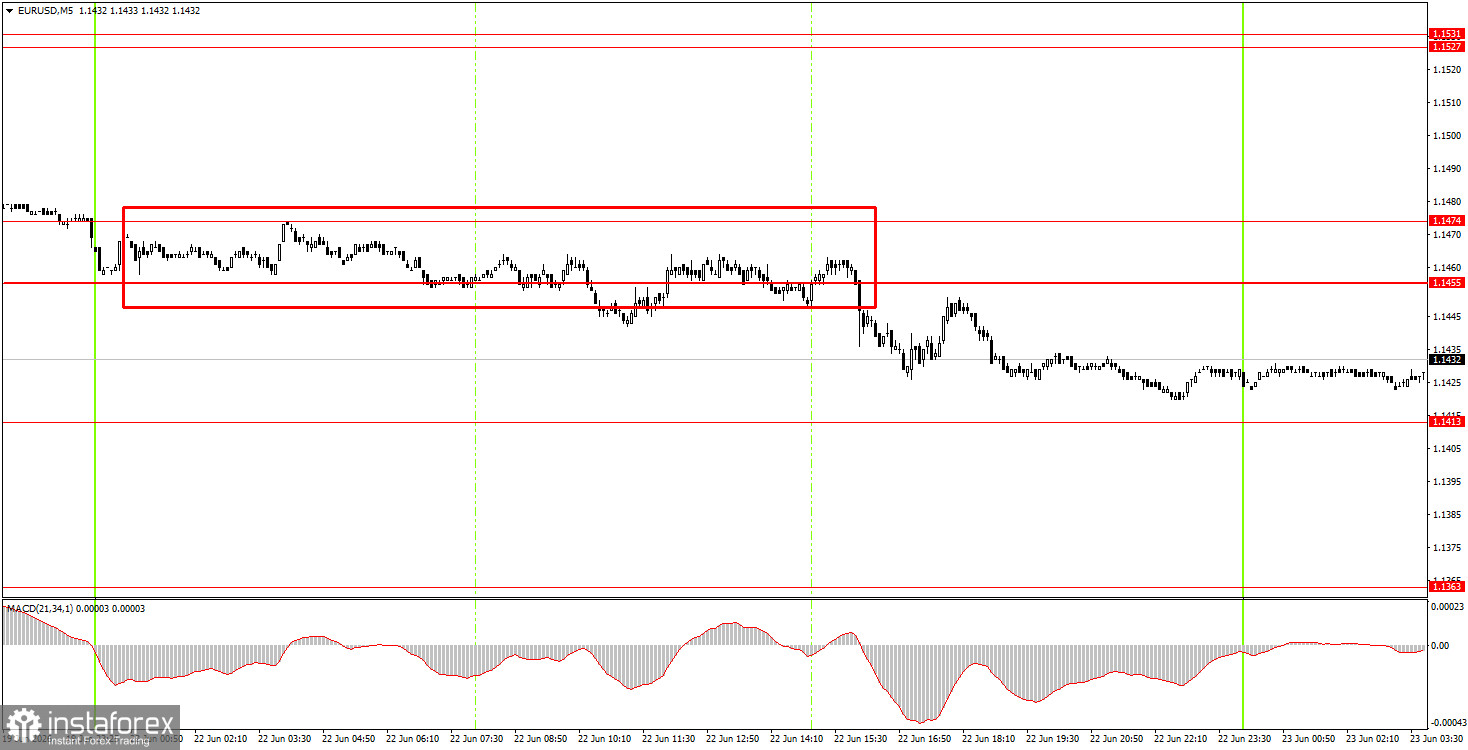
In the 5-minute timeframe on Monday, one sell trading signal was formed. It was created around 3 PM, but during the American trading session, the pair broke away from the 1.1455-1.1474 range and declined by 20 pips. Better than nothing.
On the hourly timeframe, the downward trend has resumed. Since the deal between Iran and the U.S. was signed, the market has one less reason to buy the U.S. dollar. However, the deal could collapse at any moment, as Israel and Lebanon continue to attack each other, and the market ignores factors in favor of the euro. Thus, the dollar remains in a more advantageous position.
On Tuesday, novice traders can open short positions with targets of 1.1354-1.1363 if the price consolidates below 1.1413. Long positions can be opened with a target of 1.1455-1.1474 if the price bounces off 1.1413.
On the 5-minute timeframe, the following levels should be considered: 1.1292, 1.1354-1.1363, 1.1413, 1.1455-1.1474, 1.1527-1.1531, 1.1584-1.1594, 1.1655-1.1666, 1.1745-1.1754, 1.1830-1.1837. On Tuesday, the U.S., Germany, and the Eurozone will publish indices of business activity in the services and manufacturing sectors for June. We do not consider this data important, but it could provoke a slight reaction in the first half of the day.
Price levels (areas) of support and resistance are targets when opening long or short positions or sources of signals.
Red lines indicate channels or trend lines that display the current trend and indicate the preferred direction for trading.
The MACD indicator (14,22,3) – histogram and signal line – is a supplementary indicator that can also be used as a source of signals.
Important speeches and reports (contained in the news calendar) can significantly impact the movement of the currency pair. Therefore, during their release, trading should be conducted with maximum caution, or one should exit the market to avoid sharp reversals against preceding movements.
Beginners trading in the forex market should remember that not every trade can be profitable. Developing a clear strategy and practicing money management are key to long-term success in trading.
*यहां पर लिखा गया बाजार विश्लेषण आपकी जागरूकता बढ़ाने के लिए किया है, लेकिन व्यापार करने के लिए निर्देश देने के लिए नहीं |
InstaSpot analytical reviews will make you fully aware of market trends! Being an InstaSpot client, you are provided with a large number of free services for efficient trading.


