


हमारी टीम के पास 7,000,000 से अधिक ट्रेडर हैं!
प्रतिदिन हम ट्रेडिंग को बेहतर बनाने के लिए एक साथ काम करते हैं। हम उच्च परिणाम प्राप्त कर रहे हैं और आगे की ओर बढ़ रहे हैं।
दुनियाभर के लाखों लोगों द्वारा हमारे काम को पहचानना, हमारे काम की सबसे अच्छी सराहना है! आपने आपनी पसंद बनाई है और हम आपकी अपेक्षाओं को पूरा करने के लिए हर संभव प्रयास करेंगे!
हम एक साथ एक अच्छी टीम हैं!
इंस्टाफॉरेक्स को इस बात का गर्व है कि वह आपके लिए काम कर रहा है!


एक्टर, यूएफसी 6 टूर्नामेंट का विजेता और एक सच्चा हीरो!
वह आदमी, जिसने अपनी मेहनत से सब किया है। वह आदमी, जो हमारे रास्तों पर चलता है.
टैक्टारोव की सफलता का राज लक्ष्य की ओर लगातर अग्रसर रहना है।
अपनी प्रतिभा के सभी पक्षों को प्रकट करें!
खोज करें, कोशिश करें, विफल हो-लेकिन कभी न रूकें!
इंस्टाफॉरेक्स- हमारी सफलताओं की कहानी यहाँ से शुरू होती है!

The GBP/USD currency pair dropped at the open on Monday, similar to the EUR/USD pair, but fully recovered throughout the day. Thus, market concerns about the failure of negotiations between Iran and the US were short-lived, and there was virtually no reaction regarding the US blockade of the Strait of Hormuz. Donald Trump announced the blockade of the Strait of Hormuz last night and warned that all ships attempting to breach the blockade would be destroyed. Naturally, this primarily concerns Iranian tankers. However, Trump also warned foreign vessels that pay Iran for passage through the strait. Consequently, the situation in the Middle East has not improved over the past few days, but the market does not perceive it as having worsened either. The Strait of Hormuz remains blocked, just as it was before.
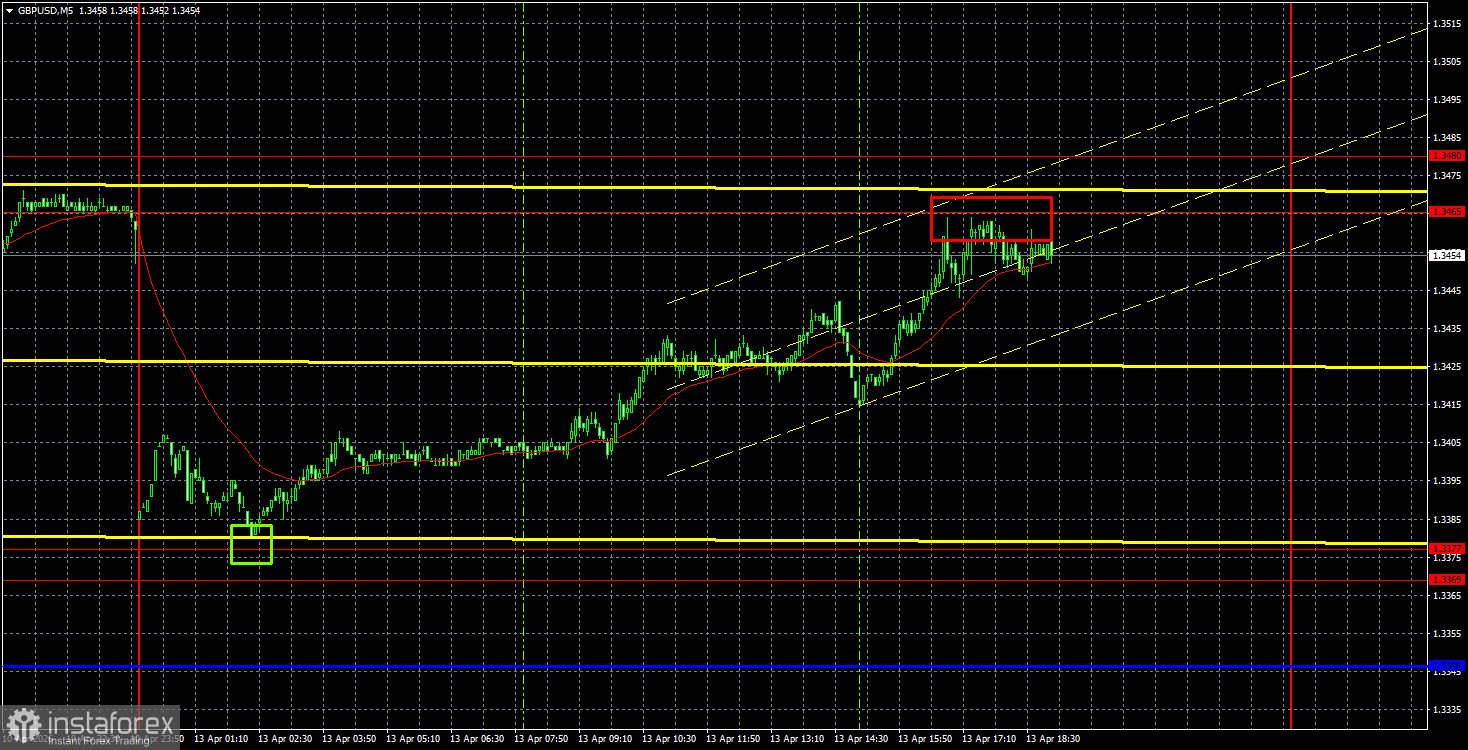
From a technical perspective, a new upward trend is undeniable, but in recent days, the GBP/USD pair has been trading within a sideways channel between 1.3369-1.3377 and 1.3465-1.3480. Thus, currently, the focus is on ranging rather than trending behavior. The British pound has failed to break through the 1.3465-1.3480 area twice, suggesting a third bounce is possible. We can only note the decreasing influence of geopolitics on trader sentiment. Just a month ago, news similar to what was received over the weekend would have triggered a significant rise in the US dollar.
On the 5-minute timeframe, exactly one trading signal was formed yesterday in the form of a bounce with a small deviation from the area of 1.3369-1.3377. The remaining part of the day saw the British currency rise, and by the end of the day, it traded in the 1.3465-1.3480 range. Now, a price bounce from this area could trigger a new wave of downward movement within the range, while a breakout would further solidify the upward trend.
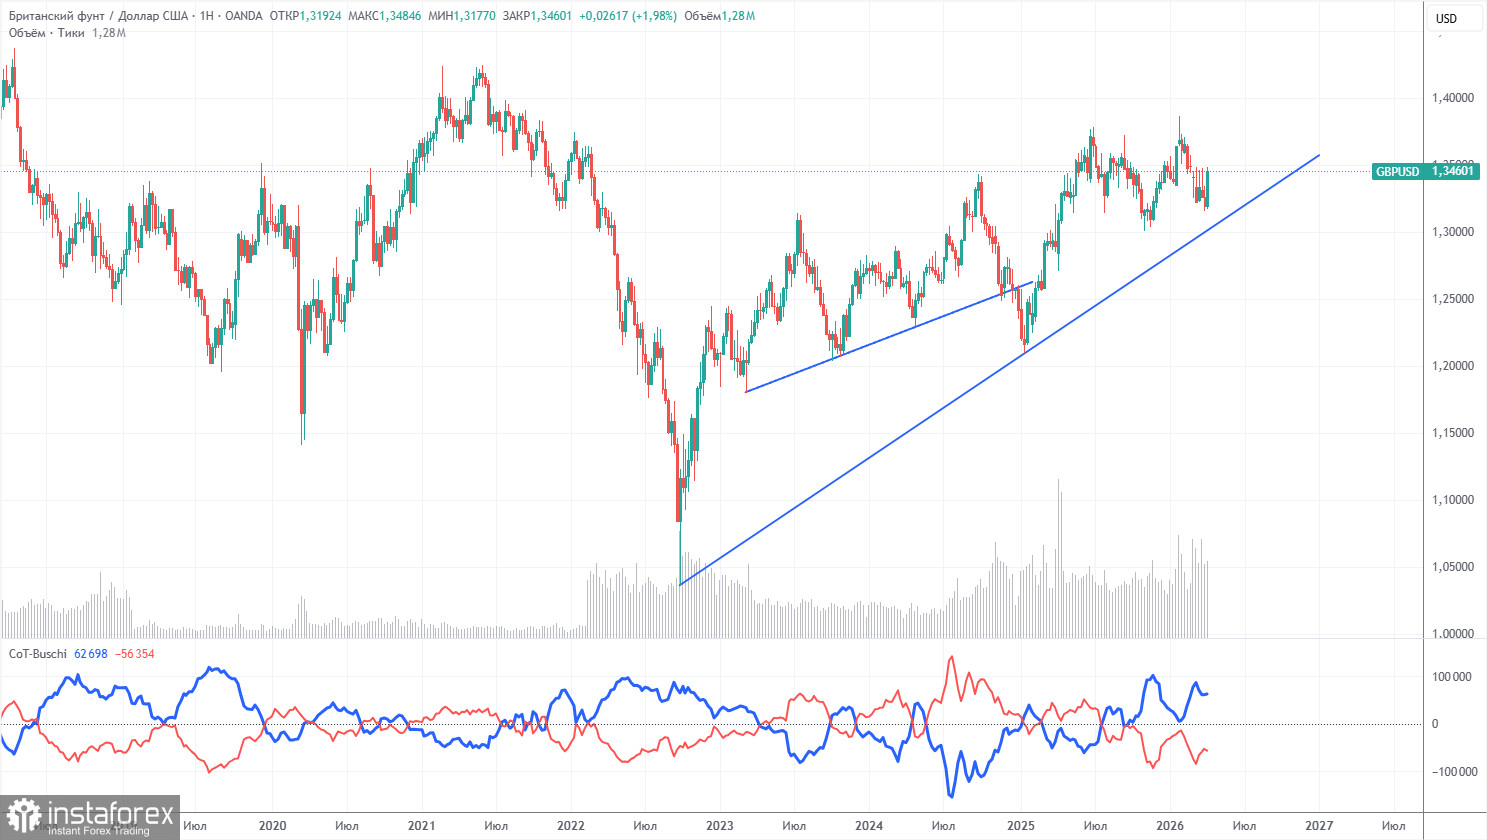
The COT reports for the British pound show that, in recent years, commercial traders' sentiment has been constantly changing. The red and blue lines representing the net positions of commercial and non-commercial traders frequently cross each other and are usually close to the zero mark. Currently, the lines are diverging, with non-commercial traders still dominating with... selling positions. However, given the events in the Middle East, it is not surprising that demand for riskier currencies is falling while demand for the dollar is rising.
In the long term, the dollar continues to decline due to Donald Trump's policies, as shown on the weekly timeframe (illustration above). The trade war will continue in one form or another for a long time, but geopolitical factors currently take precedence, providing strong support to the US dollar. According to the latest COT report (from April 7), the "Non-commercial" group closed 3,900 buy contracts and 300 sell contracts. Thus, the net position of non-commercial traders decreased by 3,600 contracts over the week.
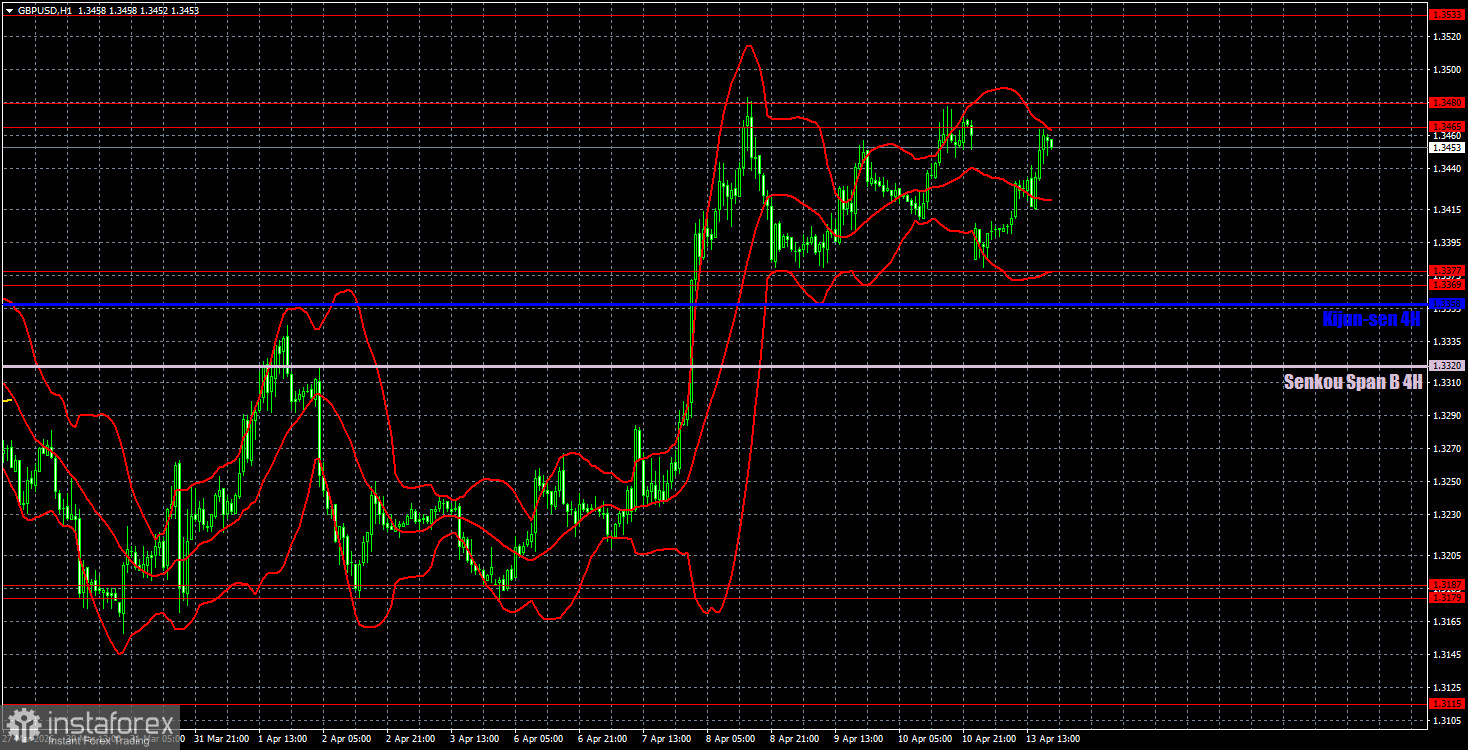
On the hourly timeframe, the GBP/USD pair continues to form an upward trend, which can be reversed at any time. The market continues to closely monitor events in the Middle East, which drive 90% of market movements. It should be noted that the influence of geopolitics is weakening, based on Monday's movements, but military actions in the region are still on pause. The Strait of Hormuz was blocked even before Trump's blockade.
On April 14, we highlight the following important levels for trading: 1.3096-1.3115, 1.3179-1.3187, 1.3369-1.3377, 1.3465-1.3480, 1.3533-1.3548, 1.3615, 1.3671-1.3681, and 1.3751-1.3763. The Senkou Span B line (1.3320) and Kijun-sen line (1.3358) can also serve as sources of signals. It is recommended to set the Stop Loss level to breakeven when the price has moved in the correct direction by 20 pips. The lines of the Ichimoku indicator may shift throughout the day, which should be taken into account when determining trading signals.
On Tuesday, no significant events are scheduled in the UK, while the US will release the weekly ADP report and the Producer Price Index (PPI). We consider both reports to be of secondary importance and do not expect a market reaction to them.
On Tuesday, traders may consider short positions if the price bounces from the 1.1750-1.1760 area, targeting 1.1657-1.1666. Long positions can be maintained with a target of 1.1750-1.1760, as the price has bounced from the 1.1657-1.1666 area.
Support and resistance price levels are thick red lines around which the movement may end. They are not sources of trading signals.
The Kijun-sen and Senkou Span B lines are lines of the Ichimoku indicator, transferred to the hourly timeframe from the 4-hour timeframe. They are strong lines.
Extreme levels are thin red lines from which the price previously rebounded. They are sources of trading signals.
Yellow lines are trend lines, trend channels, and any other technical patterns.
Indicator 1 on the COT charts shows the size of the net position of each category of traders.
*यहां पर लिखा गया बाजार विश्लेषण आपकी जागरूकता बढ़ाने के लिए किया है, लेकिन व्यापार करने के लिए निर्देश देने के लिए नहीं |
InstaSpot analytical reviews will make you fully aware of market trends! Being an InstaSpot client, you are provided with a large number of free services for efficient trading.


