


हमारी टीम के पास 7,000,000 से अधिक ट्रेडर हैं!
प्रतिदिन हम ट्रेडिंग को बेहतर बनाने के लिए एक साथ काम करते हैं। हम उच्च परिणाम प्राप्त कर रहे हैं और आगे की ओर बढ़ रहे हैं।
दुनियाभर के लाखों लोगों द्वारा हमारे काम को पहचानना, हमारे काम की सबसे अच्छी सराहना है! आपने आपनी पसंद बनाई है और हम आपकी अपेक्षाओं को पूरा करने के लिए हर संभव प्रयास करेंगे!
हम एक साथ एक अच्छी टीम हैं!
इंस्टाफॉरेक्स को इस बात का गर्व है कि वह आपके लिए काम कर रहा है!


एक्टर, यूएफसी 6 टूर्नामेंट का विजेता और एक सच्चा हीरो!
वह आदमी, जिसने अपनी मेहनत से सब किया है। वह आदमी, जो हमारे रास्तों पर चलता है.
टैक्टारोव की सफलता का राज लक्ष्य की ओर लगातर अग्रसर रहना है।
अपनी प्रतिभा के सभी पक्षों को प्रकट करें!
खोज करें, कोशिश करें, विफल हो-लेकिन कभी न रूकें!
इंस्टाफॉरेक्स- हमारी सफलताओं की कहानी यहाँ से शुरू होती है!

The EUR/USD currency pair resumed its downward movement on Wednesday, influenced by two factors. First, the US Producer Price Index (PPI) rose by 0.7% in February, significantly above forecasts. Second, the Federal Reserve demonstrated a tightening of its monetary views. In our opinion, even yesterday, the market could have done without new dollar purchases, considering its growth over the past month and a half. However, there were formal reasons. If the PPI is rising, inflation will also increase, as producer prices are passed through to retail prices. If the Fed previously expected two rate cuts in 2026 and now only one, this tightening of monetary expectations also favors the dollar. However, amid rising concerns about accelerating inflation, this is the scenario most traders anticipated. Yet, as we see, the market did not preemptively respond to its own expectations this time; rather, it waited for another reason to buy the American currency.
Thus, once again, the break of the descending trendline led to nothing. All traders can clearly see that technical factors have simply not been working for the last month. The price is breaking the third or fourth trendline in a row, then calmly heads back south. In our view, the problem remains in the geopolitical backdrop, which simply undermines all other factors and types of analysis.
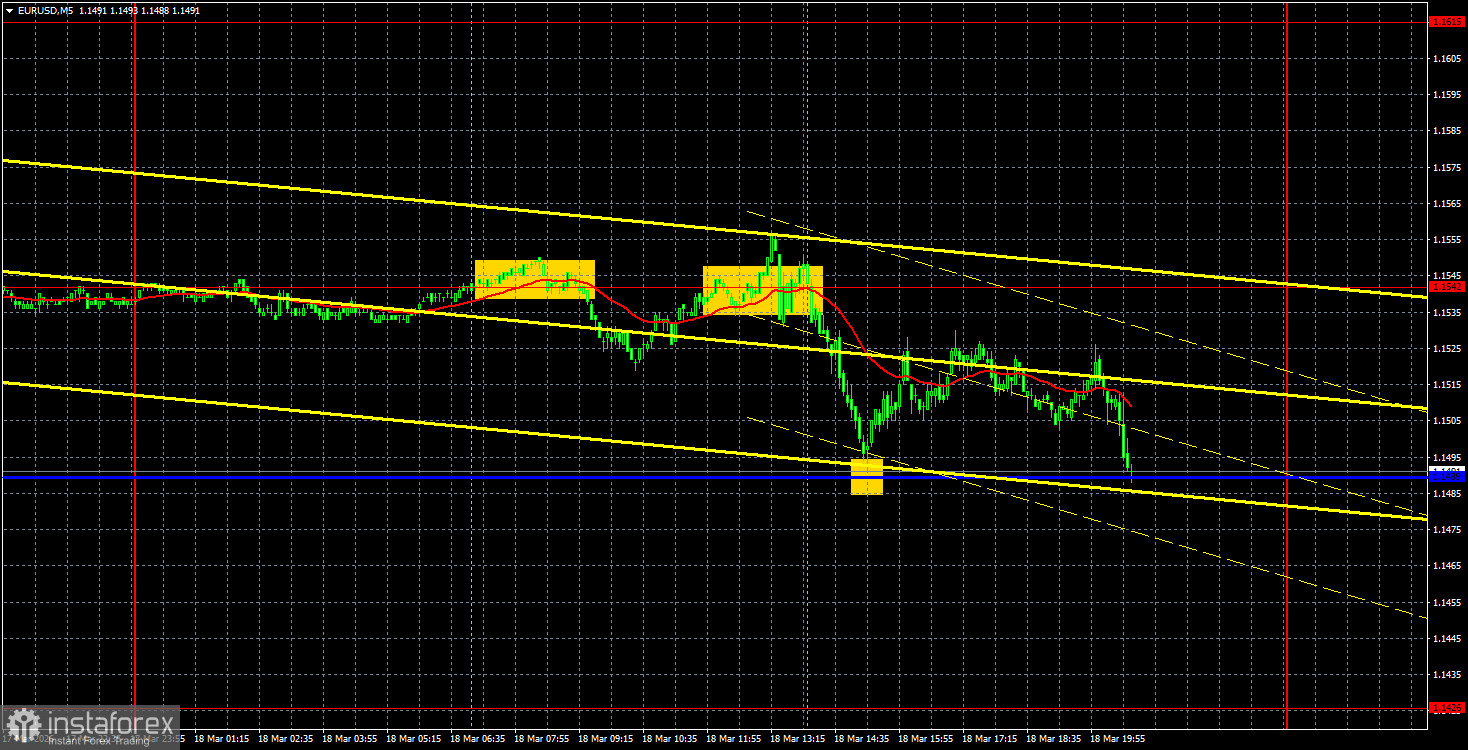
On the 5-minute time frame on Wednesday, three rather imprecise signals were formed. The price bounced off the 1.1542 level twice before eventually falling to the Kijun-sen line. Therefore, traders could open a short position, but neither signal was the most precise. The bounce from the critical line allowed for long positions, but the price could not reach the target level. Then another collapse began...
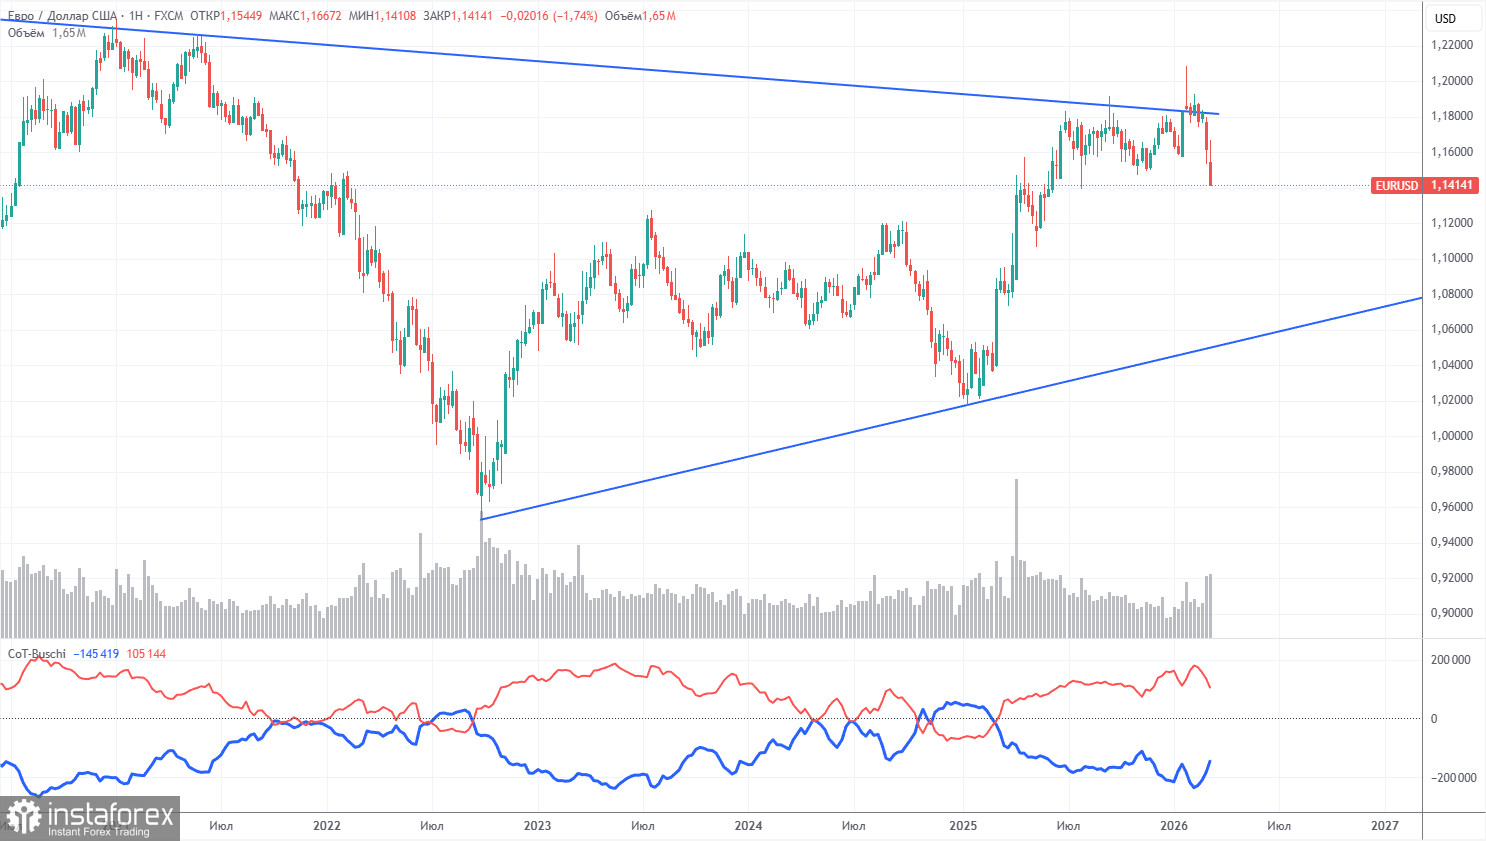
The latest COT report is dated March 10. The illustration on the weekly time frame clearly shows that the net position of non-commercial traders remains "bullish," while since Trump took office as president of the United States for the second time, only the dollar has been falling. In recent weeks, the American currency has appreciated due to geopolitical reasons, but the long-term upward trend remains intact.
We still do not see any fundamental factors supporting the strengthening of the European currency. However, there are plenty of factors favoring a decline of the American dollar. The war in the Middle East made the dollar temporarily super-attractive, but when this factor expires is an open question. In the long term, the euro could fall to 1.06 (the trendline), but the upward trend will remain relevant.
The positioning of the red and blue lines of the indicator continues to indicate a persistent "bullish" trend. Over the last reporting week, the number of longs in the "Non-commercial" group decreased by 28,900, while the number of shorts decreased by 2,500. Accordingly, the net position decreased by 25,400 contracts over the week.
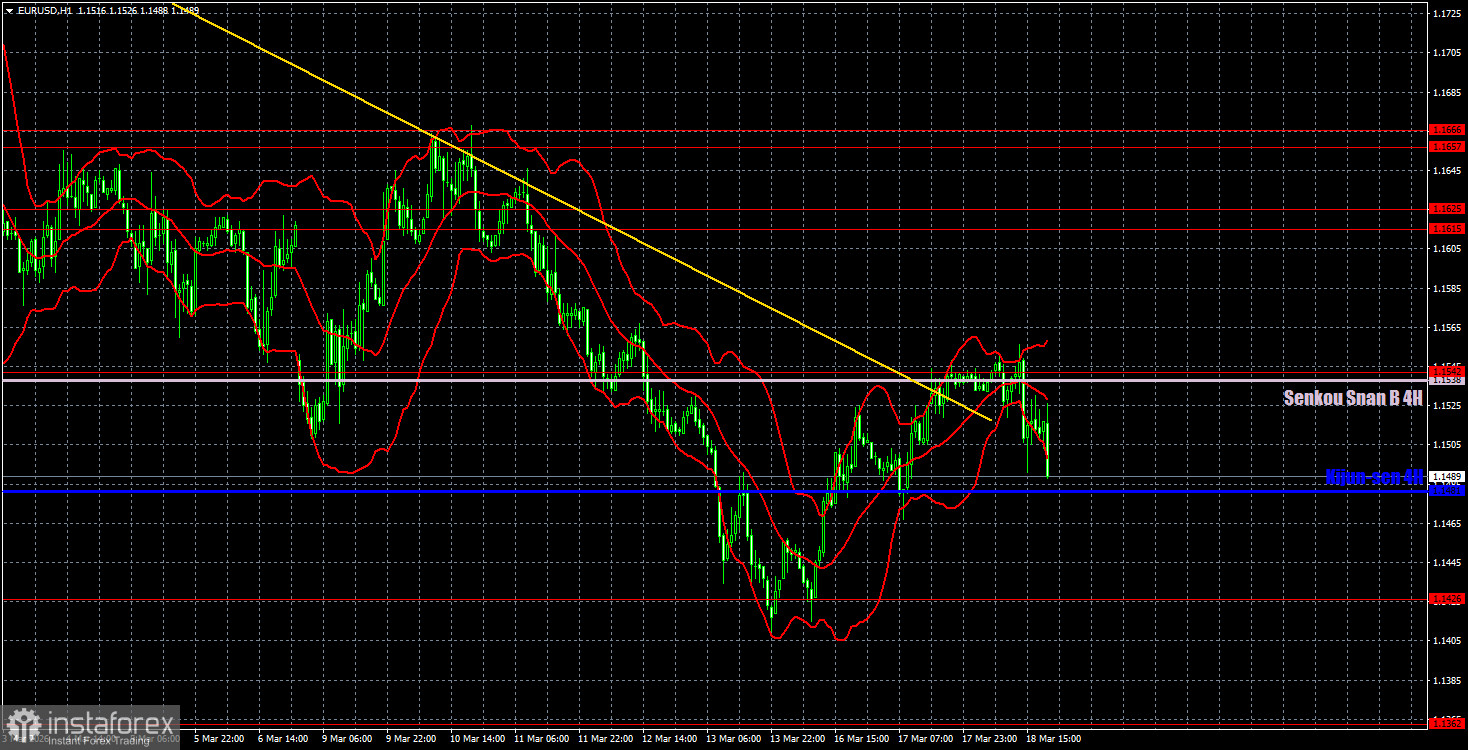
On the hourly time frame, the EUR/USD pair could have completed its downward trend this week, but the market ultimately chose to reflect the Fed's tighter stance on monetary policy. A new escalation in the Middle East, new shocks in the oil or gas markets, and the expansion of the conflict beyond the Middle East could also provoke a new wave of dollar purchases. Once again, breaking the trendline did not work. Currently, only geopolitics and factors favoring the dollar are at play.
For March 19, we highlight the following levels for trading: 1.1234, 1.1274, 1.1362, 1.1426, 1.1542, 1.1615–1.1625, 1.1657–1.1666, 1.1750–1.1760, 1.1830–1.1837, as well as the Senkou Span B line (1.1538) and the Kijun-sen line (1.1481). The Ichimoku indicator lines may shift throughout the day, which should be taken into account when determining trading signals. Don't forget to set a Stop Loss order to break even if the price moves in the correct direction by 15 pips. This will protect you from potential losses if the signal turns out to be false.
On Thursday, the ECB meeting in the Eurozone could prevent the euro from suffering another setback. If the ECB signals that a tightening of monetary policy is possible soon, this could improve the euro's position. However, it is far from certain that the market will want to sell the dollar and buy euros, even if there are grounds to do so.
On Thursday, traders may consider new short positions if the price consolidates below the Kijun-sen line with a target at 1.1426. Long positions can be considered if the price consolidates above the Senkou Span B line or bounces from the Kijun-sen line, targeting the 1.1615–1.1625 area.
*यहां पर लिखा गया बाजार विश्लेषण आपकी जागरूकता बढ़ाने के लिए किया है, लेकिन व्यापार करने के लिए निर्देश देने के लिए नहीं |
InstaSpot analytical reviews will make you fully aware of market trends! Being an InstaSpot client, you are provided with a large number of free services for efficient trading.


