


हमारी टीम के पास 7,000,000 से अधिक ट्रेडर हैं!
प्रतिदिन हम ट्रेडिंग को बेहतर बनाने के लिए एक साथ काम करते हैं। हम उच्च परिणाम प्राप्त कर रहे हैं और आगे की ओर बढ़ रहे हैं।
दुनियाभर के लाखों लोगों द्वारा हमारे काम को पहचानना, हमारे काम की सबसे अच्छी सराहना है! आपने आपनी पसंद बनाई है और हम आपकी अपेक्षाओं को पूरा करने के लिए हर संभव प्रयास करेंगे!
हम एक साथ एक अच्छी टीम हैं!
इंस्टाफॉरेक्स को इस बात का गर्व है कि वह आपके लिए काम कर रहा है!


एक्टर, यूएफसी 6 टूर्नामेंट का विजेता और एक सच्चा हीरो!
वह आदमी, जिसने अपनी मेहनत से सब किया है। वह आदमी, जो हमारे रास्तों पर चलता है.
टैक्टारोव की सफलता का राज लक्ष्य की ओर लगातर अग्रसर रहना है।
अपनी प्रतिभा के सभी पक्षों को प्रकट करें!
खोज करें, कोशिश करें, विफल हो-लेकिन कभी न रूकें!
इंस्टाफॉरेक्स- हमारी सफलताओं की कहानी यहाँ से शुरू होती है!

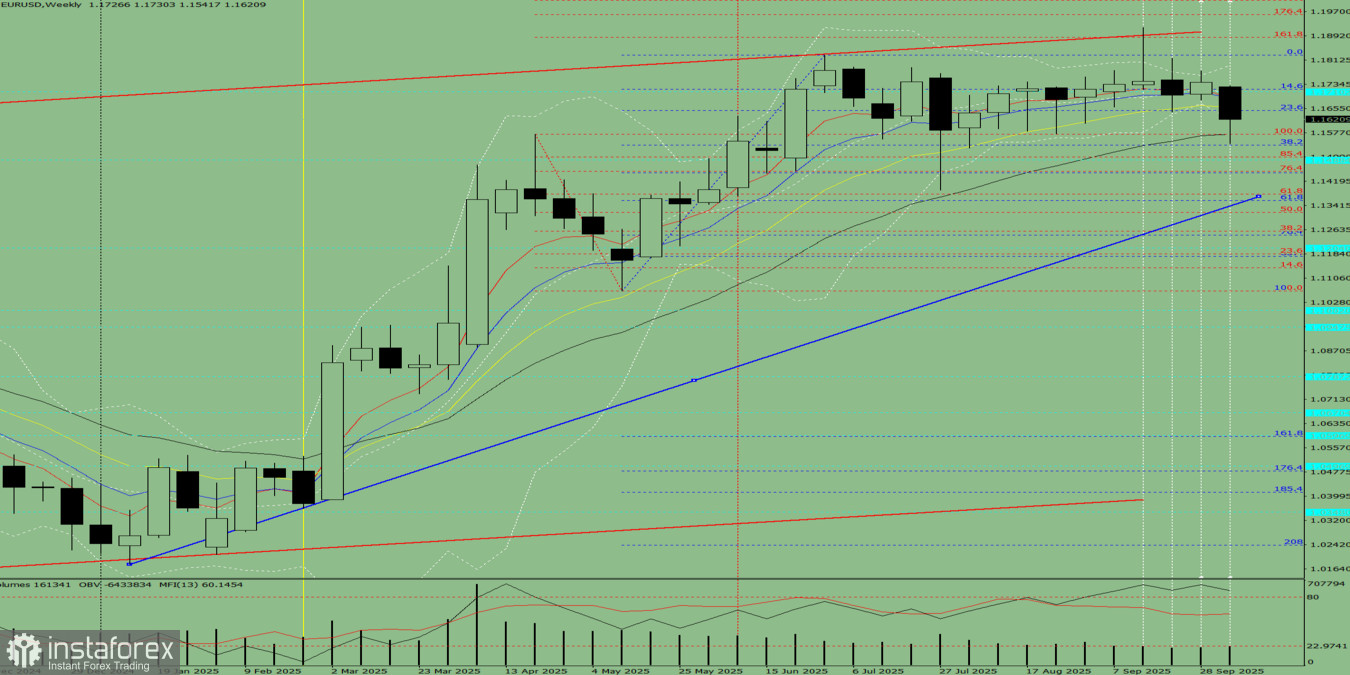
Figure 1: Weekly Chart
Comprehensive Analysis
Conclusion of comprehensive analysis: downward movement.
Overall Summary for the Weekly EUR/USD Candle
Throughout the week, the price is most likely to show a downward trend, with no upper shadow on the weekly black (bearish) candle (Monday — down) and a lower shadow forming by Friday (Friday — up).
Alternative Scenario
From the level of 1.1621 (closing price of the last weekly candle), the pair may continue its downward movement toward 1.1447 — the 50% retracement level (blue dashed line). Upon testing this level, the price may start moving upward, targeting 1.1488 — the historical support level (light blue dashed line).
*यहां पर लिखा गया बाजार विश्लेषण आपकी जागरूकता बढ़ाने के लिए किया है, लेकिन व्यापार करने के लिए निर्देश देने के लिए नहीं |
InstaSpot analytical reviews will make you fully aware of market trends! Being an InstaSpot client, you are provided with a large number of free services for efficient trading.


