




हमारी टीम के पास 7,000,000 से अधिक ट्रेडर हैं!
प्रतिदिन हम ट्रेडिंग को बेहतर बनाने के लिए एक साथ काम करते हैं। हम उच्च परिणाम प्राप्त कर रहे हैं और आगे की ओर बढ़ रहे हैं।
दुनियाभर के लाखों लोगों द्वारा हमारे काम को पहचानना, हमारे काम की सबसे अच्छी सराहना है! आपने आपनी पसंद बनाई है और हम आपकी अपेक्षाओं को पूरा करने के लिए हर संभव प्रयास करेंगे!
हम एक साथ एक अच्छी टीम हैं!
इंस्टाफॉरेक्स को इस बात का गर्व है कि वह आपके लिए काम कर रहा है!





एक्टर, यूएफसी 6 टूर्नामेंट का विजेता और एक सच्चा हीरो!
वह आदमी, जिसने अपनी मेहनत से सब किया है। वह आदमी, जो हमारे रास्तों पर चलता है.
टैक्टारोव की सफलता का राज लक्ष्य की ओर लगातर अग्रसर रहना है।
अपनी प्रतिभा के सभी पक्षों को प्रकट करें!
खोज करें, कोशिश करें, विफल हो-लेकिन कभी न रूकें!
इंस्टाफॉरेक्स- हमारी सफलताओं की कहानी यहाँ से शुरू होती है!

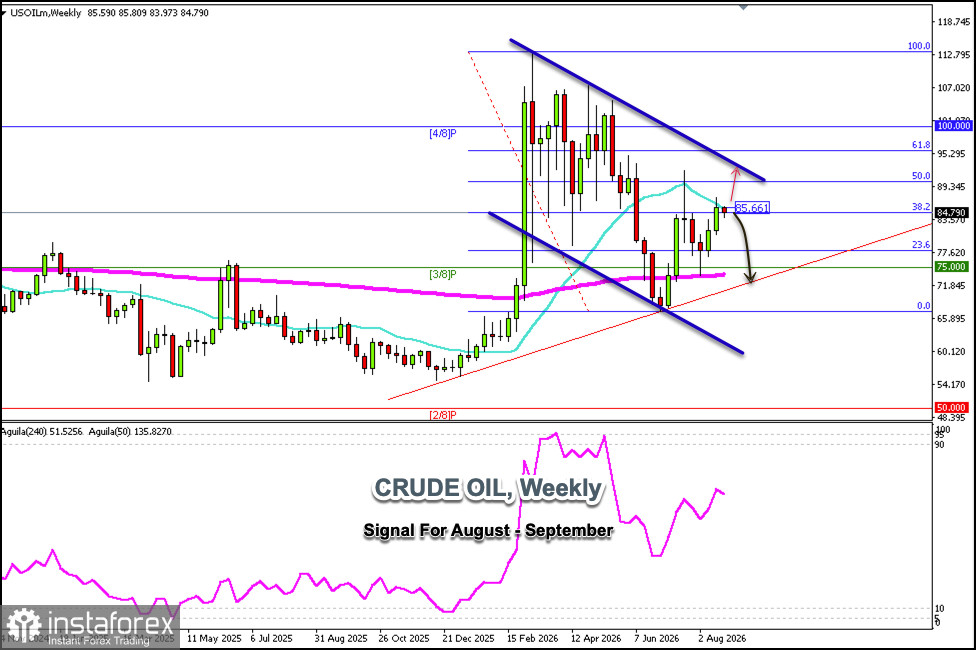
Crude oil is trading around $84.79. The weekly chart shows that, following the rally above $66, crude oil reached the 38.2% Fibonacci level and could continue to rise in the coming days until it reaches the 61.8% level, around $96.
Crude oil has left a gap around $95, and from a technical perspective, before going on with its downtrend, the instrument might continue rising and fill this technical gap.
If, in the coming days, crude oil consolidates below the 21-period simple moving average (SMA) at $85.66, we could continue selling in anticipation of the price reaching the 23.6% Fibonacci level around $78. Ultimately, crude oil could find strong support around the 3/8 Murray level at $75, which also coincides with the 200-period simple moving average (SMA).
Since the trend for crude oil remains bullish, a consolidation above $86 could extend the uptrend, and we could expect it to reach the 50% Fibonacci retracement level—the high reached in July. We also anticipate it will reach the psychological level of $100 in the coming weeks.
According to the weekly chart, oil has upside potential, so any pullback toward the 200-day EMA or the 3/8 Murray level could be considered an opportunity to open long positions.
*यहां पर लिखा गया बाजार विश्लेषण आपकी जागरूकता बढ़ाने के लिए किया है, लेकिन व्यापार करने के लिए निर्देश देने के लिए नहीं |
InstaSpot analytical reviews will make you fully aware of market trends! Being an InstaSpot client, you are provided with a large number of free services for efficient trading.


