




हमारी टीम के पास 7,000,000 से अधिक ट्रेडर हैं!
प्रतिदिन हम ट्रेडिंग को बेहतर बनाने के लिए एक साथ काम करते हैं। हम उच्च परिणाम प्राप्त कर रहे हैं और आगे की ओर बढ़ रहे हैं।
दुनियाभर के लाखों लोगों द्वारा हमारे काम को पहचानना, हमारे काम की सबसे अच्छी सराहना है! आपने आपनी पसंद बनाई है और हम आपकी अपेक्षाओं को पूरा करने के लिए हर संभव प्रयास करेंगे!
हम एक साथ एक अच्छी टीम हैं!
इंस्टाफॉरेक्स को इस बात का गर्व है कि वह आपके लिए काम कर रहा है!





एक्टर, यूएफसी 6 टूर्नामेंट का विजेता और एक सच्चा हीरो!
वह आदमी, जिसने अपनी मेहनत से सब किया है। वह आदमी, जो हमारे रास्तों पर चलता है.
टैक्टारोव की सफलता का राज लक्ष्य की ओर लगातर अग्रसर रहना है।
अपनी प्रतिभा के सभी पक्षों को प्रकट करें!
खोज करें, कोशिश करें, विफल हो-लेकिन कभी न रूकें!
इंस्टाफॉरेक्स- हमारी सफलताओं की कहानी यहाँ से शुरू होती है!

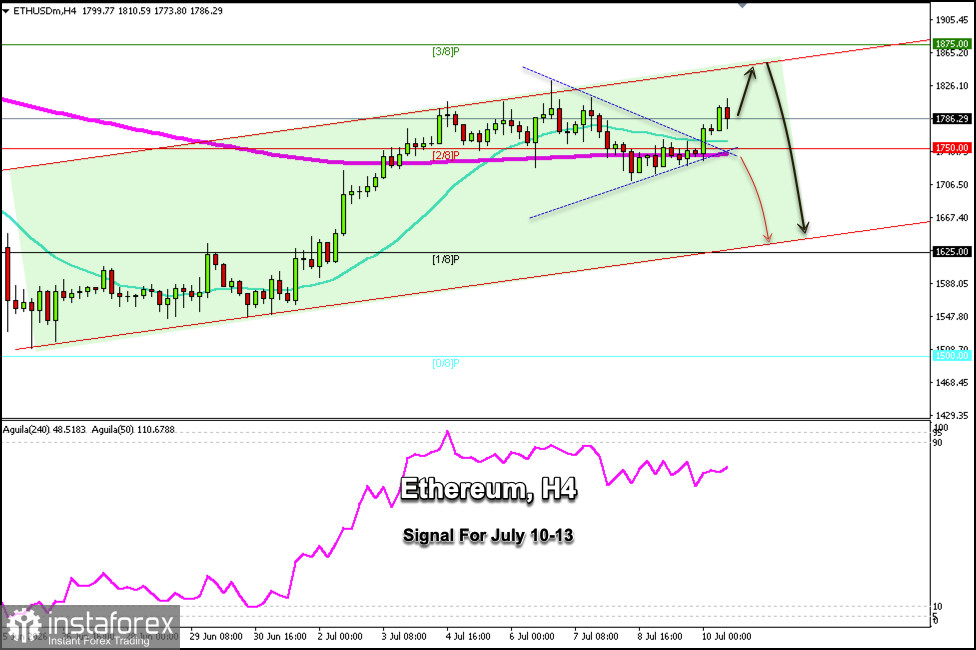
Ethereum (ETH/USD) is trading around $1,786, above the 2/8 Murray level and the 21-day moving average, which is driving it above the 200 EMA with a positive bias, although it is showing signs of exhaustion.
In the coming hours, Ethereum could continue its rise until it reaches the upper band of the bullish channel, around $1,865.
Since the Eagle indicator is reaching overbought levels, the outlook could turn negative in the coming days.
Therefore, a consolidation below the 2/8 Murray line and below the 200-day moving average could be considered an opportunity to sell Ethereum, with targets at the lower band of the bullish channel—which also coincides with the 1/8 Murray line—around $1,660.
A breakout from the symmetrical triangle pattern is seen in the chart. Thus, if ETH remains above this area, it points to a further uptrend in the coming days until the price reaches the 3/8 Murray line, which now acts as strong resistance.
If Ethereum faces strong rejection below $1,875, it will be considered an opportunity to open short positions with targets at the 1/8 Murray line.
*यहां पर लिखा गया बाजार विश्लेषण आपकी जागरूकता बढ़ाने के लिए किया है, लेकिन व्यापार करने के लिए निर्देश देने के लिए नहीं |
InstaSpot analytical reviews will make you fully aware of market trends! Being an InstaSpot client, you are provided with a large number of free services for efficient trading.


