


हमारी टीम के पास 7,000,000 से अधिक ट्रेडर हैं!
प्रतिदिन हम ट्रेडिंग को बेहतर बनाने के लिए एक साथ काम करते हैं। हम उच्च परिणाम प्राप्त कर रहे हैं और आगे की ओर बढ़ रहे हैं।
दुनियाभर के लाखों लोगों द्वारा हमारे काम को पहचानना, हमारे काम की सबसे अच्छी सराहना है! आपने आपनी पसंद बनाई है और हम आपकी अपेक्षाओं को पूरा करने के लिए हर संभव प्रयास करेंगे!
हम एक साथ एक अच्छी टीम हैं!
इंस्टाफॉरेक्स को इस बात का गर्व है कि वह आपके लिए काम कर रहा है!


एक्टर, यूएफसी 6 टूर्नामेंट का विजेता और एक सच्चा हीरो!
वह आदमी, जिसने अपनी मेहनत से सब किया है। वह आदमी, जो हमारे रास्तों पर चलता है.
टैक्टारोव की सफलता का राज लक्ष्य की ओर लगातर अग्रसर रहना है।
अपनी प्रतिभा के सभी पक्षों को प्रकट करें!
खोज करें, कोशिश करें, विफल हो-लेकिन कभी न रूकें!
इंस्टाफॉरेक्स- हमारी सफलताओं की कहानी यहाँ से शुरू होती है!

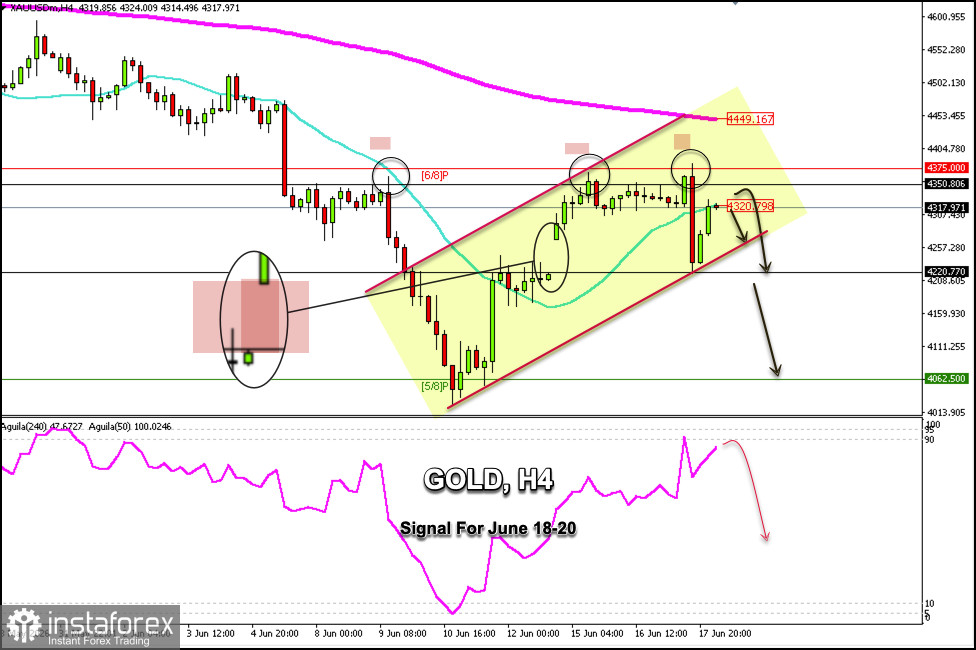
Gold is trading around $4,317 after a strong rebound from its low of $4,218, which coincided with the gap left by last week's closing price and this week's opening price.
This sharp decline in gold was due to the Fed's policy decision reflecting a hawkish outlook, which put downward pressure on gold, causing it to fall from its daily high of $4,381 to $4,218.
Gold is expected to resume its downtrend in the coming hours, but we should exercise caution, as it could still continue rising to reach $4,350—where the daily R1 is located—and this zone could present an opportunity to open short positions.
On the other hand, if we monitor the price of gold and it consolidates below $4,320—where the 21 SMA is located—this could be seen as an opportunity to open short positions with targets at $4,300, $4,257, and $4,220.
A pullback toward the $4,375 area could signal a new bullish scenario. So, if the price continues to rise, it is more likely to reach the 200 EMA around $4,449.
Technically, on the H4 chart, we observe the formation of a triple-top pattern, which suggests that gold could reach the 5/8 Murray levels around the psychological level of $4,000 in the short term.
For this bearish pattern to maintain a strong signal, XAU/USD should settle below $4,375.
*यहां पर लिखा गया बाजार विश्लेषण आपकी जागरूकता बढ़ाने के लिए किया है, लेकिन व्यापार करने के लिए निर्देश देने के लिए नहीं |
InstaSpot analytical reviews will make you fully aware of market trends! Being an InstaSpot client, you are provided with a large number of free services for efficient trading.


