


InstaSpot टीम में लीजेंड!
लीजेंड! आपको लगता है कि धमाकेदार बयानबाजी है? लेकिन हमें एक आदमी को कैसे बुलाना चाहिए, जो 18 साल की जूनियर विश्व शतरंज चैंपियनशिप जीतने वाला पहला एशियाई बना और 19 में पहला भारतीय ग्रैंडमास्टर कौन बना? यह विश्वनाथन आनंद के लिए विश्व चैंपियन खिताब के लिए एक कठिन मार्ग की शुरुआत थी, जो उस व्यक्ति के लिए हमेशा के लिए शतरंज का इतिहास बन गया। अब InstaSpot टीम में एक और लीजेंड!


बोरूसिया जर्मनी में सबसे अधिक शीर्षक वाले फुटबॉल क्लबों में से एक है, जो प्रशंसकों के लिए बार-बार साबित हुआ है: प्रतियोगिता और नेतृत्व की भावना निश्चित रूप से सफलता की ओर ले जाएगी। उसी तरह से व्यापार जिसमें खेल पेशेवर खेल खेलते हैं: आत्मविश्वास से और सक्रिय रूप से। बोरूसिया FC से एक "पास" रखें और InstaSpot के साथ नेतृत्व में रहें!

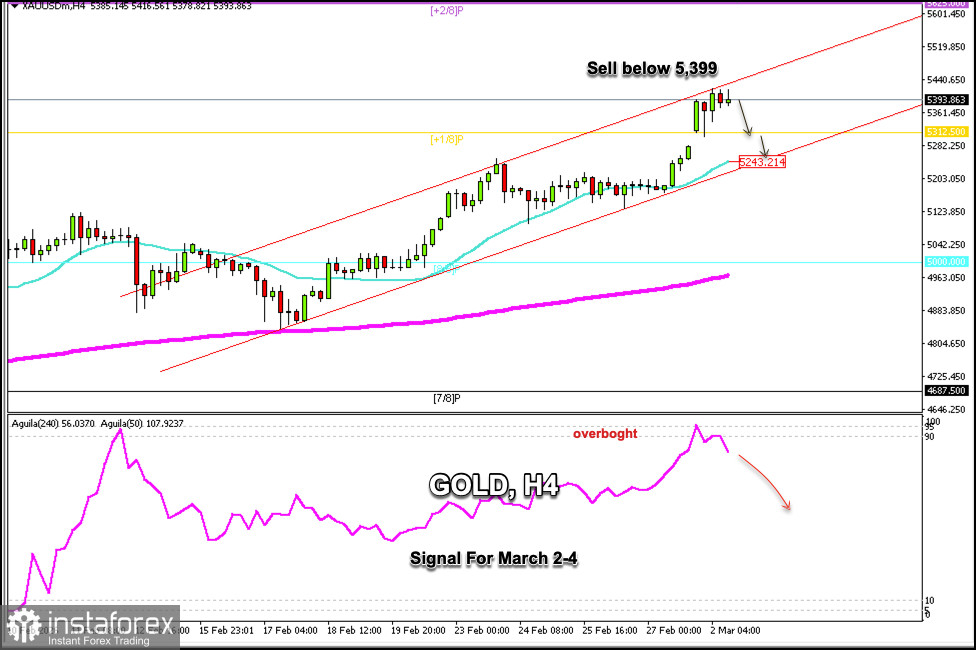
Gold is trading around $5,393, up +1/8 Murray and within the uptrend channel formed since February 17 with a bullish bias.
On the H4 chart, we can see that gold attempted to break through the strong resistance of the upper band of the uptrend channel around $5,420 during the European session.
According to the H4 chart, gold is showing signs of exhaustion in its bullish momentum. The formation of Japanese candlesticks on the 4-hour chart suggests that a technical reversal could follow.
A decline could happen in the coming hours towards the +1/8 Murray located at $5,312. Gold could even reach the lower band of the uptrend channel, which, in turn, coincides with the 21 SMA located at $5,243.
Gold left a gap around $5,275, which means that if it falls below $5,300, we could expect it to cover this gap. Therefore, the instrument could resume its upward cycle.
The Eagle indicator has reached extremely overbought levels, so a technical correction towards $5,243 is expected in the coming days.
A sharp break below the uptrend channel and a consolidation below $5,240 could be seen as a clear signal to sell gold with targets at the psychological level of $5,000 and even at the 200 EMA around $4,960.
*यहां पर लिखा गया बाजार विश्लेषण आपकी जागरूकता बढ़ाने के लिए किया है, लेकिन व्यापार करने के लिए निर्देश देने के लिए नहीं |
InstaSpot analytical reviews will make you fully aware of market trends! Being an InstaSpot client, you are provided with a large number of free services for efficient trading.


