


हमारी टीम के पास 7,000,000 से अधिक ट्रेडर हैं!
प्रतिदिन हम ट्रेडिंग को बेहतर बनाने के लिए एक साथ काम करते हैं। हम उच्च परिणाम प्राप्त कर रहे हैं और आगे की ओर बढ़ रहे हैं।
दुनियाभर के लाखों लोगों द्वारा हमारे काम को पहचानना, हमारे काम की सबसे अच्छी सराहना है! आपने आपनी पसंद बनाई है और हम आपकी अपेक्षाओं को पूरा करने के लिए हर संभव प्रयास करेंगे!
हम एक साथ एक अच्छी टीम हैं!
इंस्टाफॉरेक्स को इस बात का गर्व है कि वह आपके लिए काम कर रहा है!


एक्टर, यूएफसी 6 टूर्नामेंट का विजेता और एक सच्चा हीरो!
वह आदमी, जिसने अपनी मेहनत से सब किया है। वह आदमी, जो हमारे रास्तों पर चलता है.
टैक्टारोव की सफलता का राज लक्ष्य की ओर लगातर अग्रसर रहना है।
अपनी प्रतिभा के सभी पक्षों को प्रकट करें!
खोज करें, कोशिश करें, विफल हो-लेकिन कभी न रूकें!
इंस्टाफॉरेक्स- हमारी सफलताओं की कहानी यहाँ से शुरू होती है!

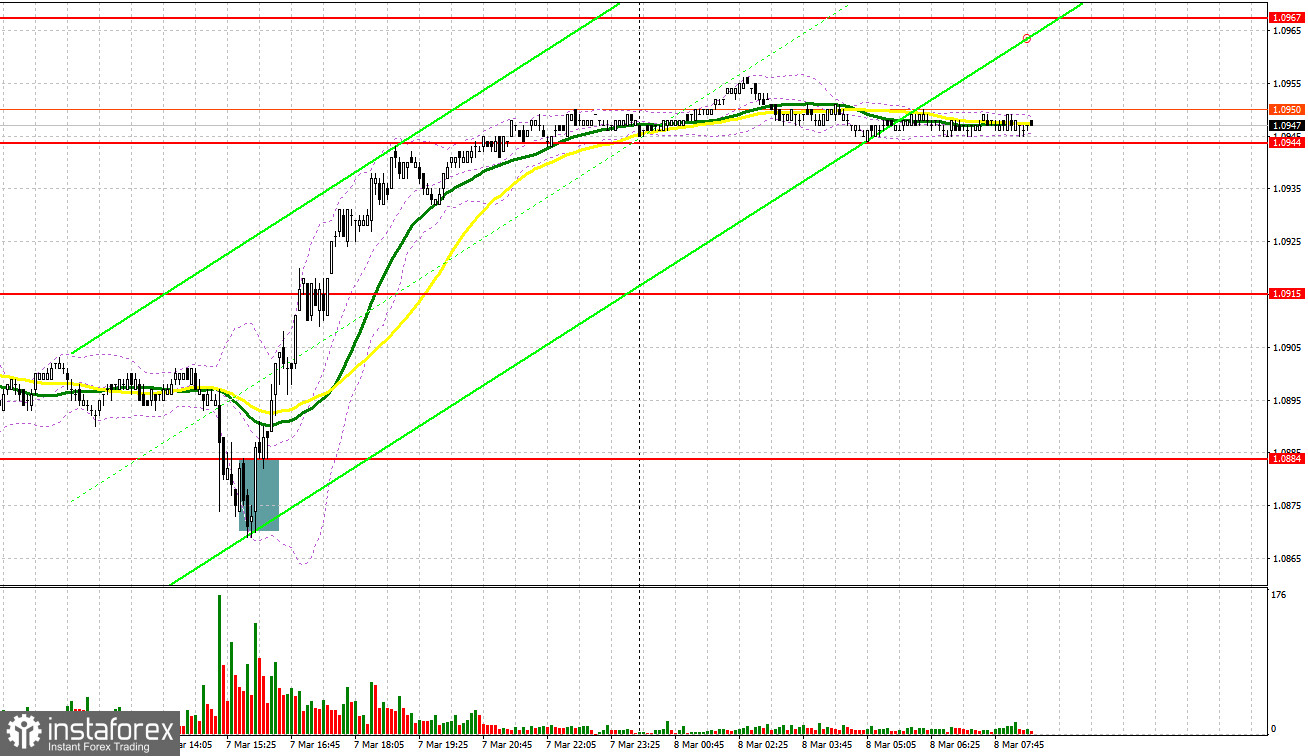
Yesterday, only one signal was generated to enter the market. Let's have a look at what happened on the 5-minute chart. In my morning review, I mentioned the level of 1.0884 as a possible entry point. The pair fell, but due to low volatility, it was not possible to form a false breakout to generate a buy signal. In the second half of the day, a false breakout near 1.0884 produced a buy signal, which sent the pair up by more than 40 pips.
What is needed to open long positions on EUR/USD
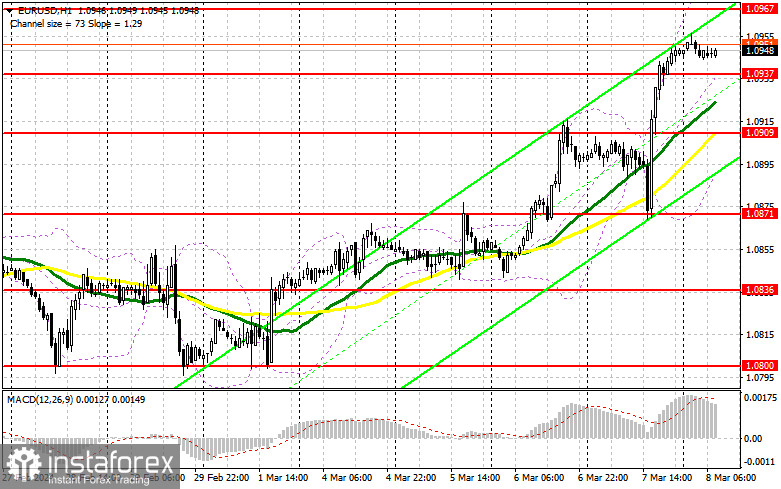
Yesterday, European Central Bank President Christine Lagarde slightly opened the door to rate cuts, but added that the Bank needs to wait for the June data. Her remarks supported the euro on Thursday, and so the upward movement persists. Today, we are waiting for the German Industrial Production report and the Producer Price Index. You may also turn to the final estimate of the Eurozone GDP Growth Rate, which is unlikely to be revised. Against this background, demand for the euro will be limited until the release of the US labor market data. For this reason, I intend to act on dips only after a false breakout in the area of the nearest support at 1.0937. Slightly below this level, we have the moving averages that favor the bulls. This will be a proper condition for buying in anticipation of the euro's continued growth to the area of 1.0967. A breakout and a downward test of this range will lead to a new bullish trend, giving a chance to buy during a climb to 1.0998. The farthest target will be the 1.1035 high, where I will take profit. If EUR/USD declines and there is no activity around 1.0937, the selling pressure on the euro will increase, which will lead to a larger drop with the prospect of testing 1.0909. I plan to enter the market there only after a false breakout has formed. I will open long positions immediately on a rebound from 1.0871, bearing in mind an upward correction of 30-35 pips within the day.
What is needed to open short positions on EUR/USD
The bears tried to stop a new trend from forming yesterday, but it did not work out as well as it had hoped. Today, only very weak Eurozone GDP data and an unsuccessful consolidation above 1.0967 are a suitable condition for selling with the prospect of testing 1.0937 - the support established yesterday. A breakout and consolidation below this range, as well as an upward retest, will provide another selling point during a slide of the price to 1.0909, where buyers will become more active. The farthest target will be the 1.0871 low, where I will take profits. If EUR/USD moves up in the first half of the day, continuing the bullish trend, and the bears do not show up at 1.0967, the buyers will retain an advantage. In this case, I will postpone selling until the test of the next resistance at 1.0998. I will also sell there, but only after an unsuccessful consolidation. I plan to open short positions immediately on a rebound from 1.1035, bearing in mind a downward correction of 30-35 pips.
COT report:
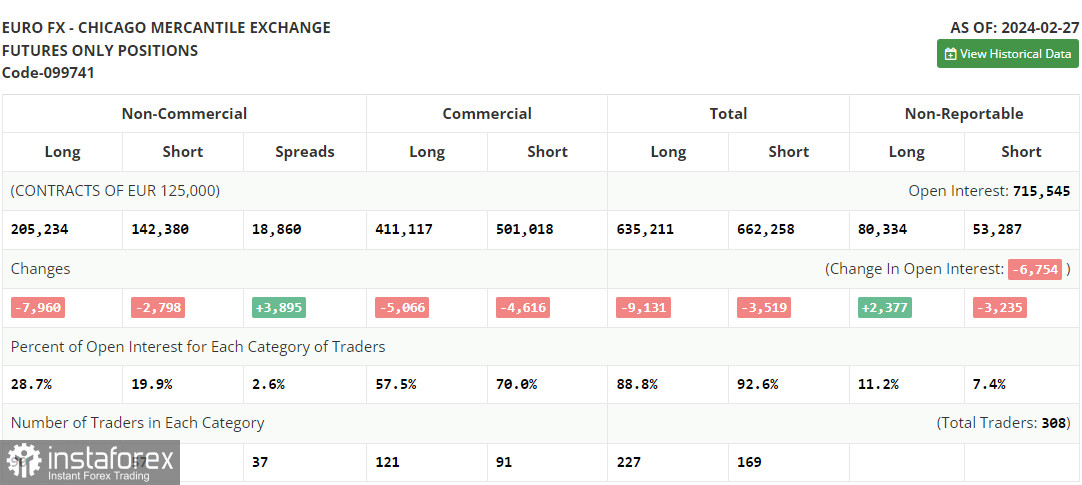
According to the COT report (Commitment of Traders) from February 27, the number of both long and short positions dropped. Apparently, a pause before the meeting of the European Central Bank and the Federal Reserve affects market volatility and the positions of large traders, preventing traders from buying risky assets. With the weak European economy, many expect the European regulator to cut rates sooner than the Fed, limiting the euro's growth. However, the ECB officials are denying this by repeatedly stating that they are not going to cut interest rates, which keeps the market balanced. The COT report indicates that long non-commercial positions fell by 7,960 to 205,234 while short non-commercial positions fell by 2,798 to 142,380. As a result, the spread between long and short positions increased by 3,895.
Indicators' signals
Moving averages
The instrument is trading above the 30 and 50-day moving averages, which points to a possible rise in the euro.
Note: The period and prices of the moving averages are considered by the analyst on the 1-hour chart and differ from the general definition of classic daily moving averages on the daily chart.
Bollinger Bands
In case EUR/USD goes down, the indicator's lower border near 1.0909 will act as support.
Description of indicators
*यहां पर लिखा गया बाजार विश्लेषण आपकी जागरूकता बढ़ाने के लिए किया है, लेकिन व्यापार करने के लिए निर्देश देने के लिए नहीं |
InstaSpot analytical reviews will make you fully aware of market trends! Being an InstaSpot client, you are provided with a large number of free services for efficient trading.


