


हमारी टीम के पास 7,000,000 से अधिक ट्रेडर हैं!
प्रतिदिन हम ट्रेडिंग को बेहतर बनाने के लिए एक साथ काम करते हैं। हम उच्च परिणाम प्राप्त कर रहे हैं और आगे की ओर बढ़ रहे हैं।
दुनियाभर के लाखों लोगों द्वारा हमारे काम को पहचानना, हमारे काम की सबसे अच्छी सराहना है! आपने आपनी पसंद बनाई है और हम आपकी अपेक्षाओं को पूरा करने के लिए हर संभव प्रयास करेंगे!
हम एक साथ एक अच्छी टीम हैं!
इंस्टाफॉरेक्स को इस बात का गर्व है कि वह आपके लिए काम कर रहा है!


एक्टर, यूएफसी 6 टूर्नामेंट का विजेता और एक सच्चा हीरो!
वह आदमी, जिसने अपनी मेहनत से सब किया है। वह आदमी, जो हमारे रास्तों पर चलता है.
टैक्टारोव की सफलता का राज लक्ष्य की ओर लगातर अग्रसर रहना है।
अपनी प्रतिभा के सभी पक्षों को प्रकट करें!
खोज करें, कोशिश करें, विफल हो-लेकिन कभी न रूकें!
इंस्टाफॉरेक्स- हमारी सफलताओं की कहानी यहाँ से शुरू होती है!

On Thursday, GBP/USD managed to both significantly rise and fall even more strongly, returning to its initial positions. The market openly rejoiced at the fact that it would have some macroeconomic information at its disposal, for the first time this week. Therefore, traders worked out quite ordinary business activity reports with the same enthusiasm it has on inflation reports or central bank meeting results. What is interesting is that the PMI data did not unequivocally support either the dollar or the pound.
In the UK, one report exceeded the forecast by only 0.1 point, and the other one did not change at all. In the United States, both indices turned out to be worse than forecasts. However, the market, as is often the case lately, interpreted the data in a way that was beneficial to it. Therefore, the pound traded positively again. And then the dollar followed suit. In general, these movements did not affect the current technical picture. The GBP/USD pair is still facing a flat. The short-term ascending trendline maintains an uptrend, but we still do not expect the pound to rally. It is already positioned quite high.
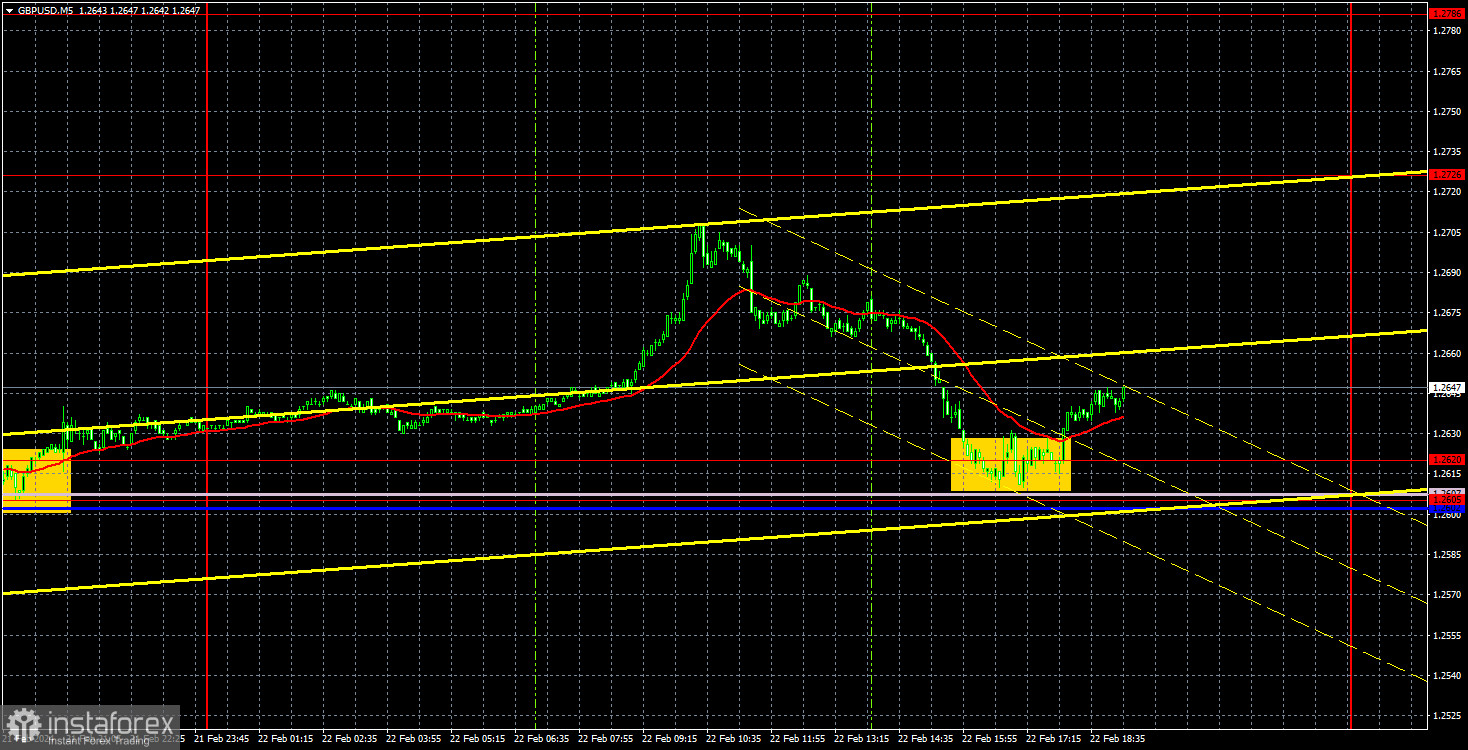
Speaking of trading signals, even with good volatility, there were none. In the morning, the pair started to rise without a rebound from the level of 1.2620. During the day, it failed to reach the level of 1.2726. During the US trading session, the pair reached the range of 1.2605-1.2620, from which a rebound occurred. This was a buy signal, and traders could execute this signal. It turned out to be profitable, although, of course, it wasn't possible to make much profit from it.
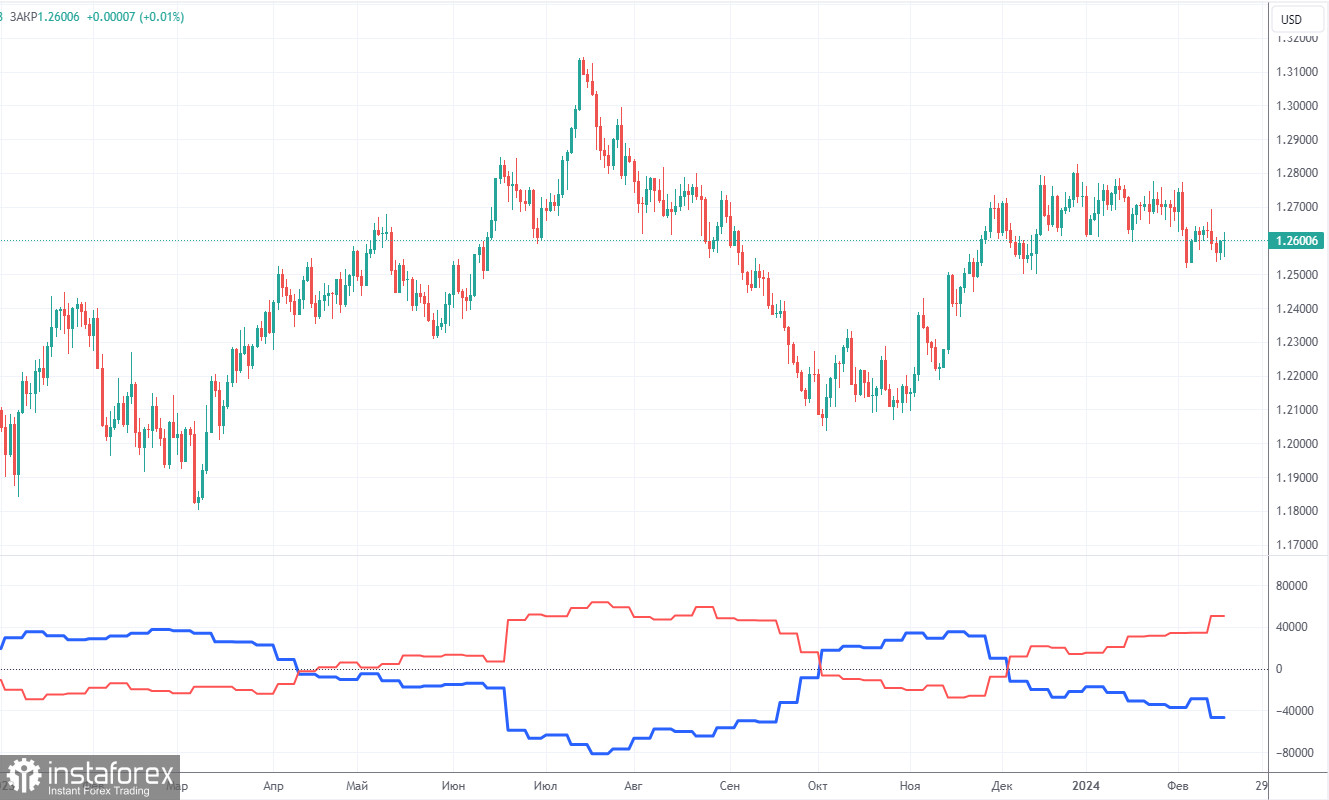
COT reports on the British pound show that the sentiment of commercial traders has frequently changed in recent months. The red and blue lines, which represent the net positions of commercial and non-commercial traders, constantly intersect and, in most cases, remain close to the zero mark. According to the latest report on the British pound, the non-commercial group opened 6,600 buy contracts and closed 9,300 short ones. As a result, the net position of non-commercial traders increased by 15,900 contracts in a week. Despite the fact that the net position of speculators is growing again, the fundamental background still does not provide a basis for long-term purchases of the pound sterling.
The non-commercial group currently has a total of 90,500 buy contracts and 40,000 sell contracts. The advantage of the bulls is almost twofold. However, in recent months, we have repeatedly encountered such situations: the net position either increases or decreases, the advantage passes from bulls to bears and vice versa. Since the COT reports do not provide an accurate forecast of the market's behavior at the moment, we need to pay close attention to the technical picture and economic reports. The technical analysis suggests that there's a possibility that the pound could show a pronounced downward movement (but there are no clear sell signals yet), and for a long time now, the economic reports have also been significantly stronger in the United States than in the United Kingdom, but this has not benefited the dollar.
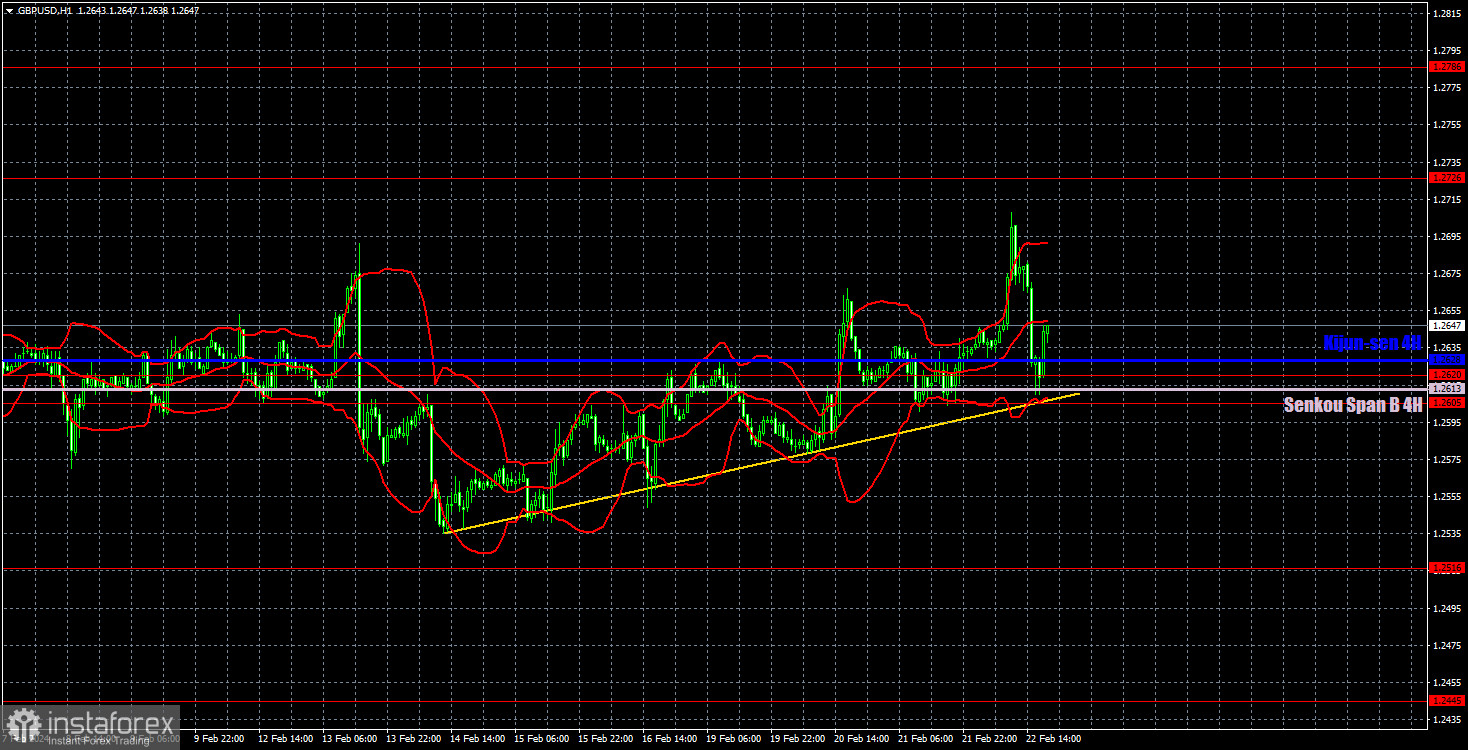
On the 1H chart, GBP/USD left the sideways channel and it still has the potential to form a downtrend. However, recently, we've noticed that the market is not in a rush to sell the pound. The price has been moving sideways (which is clear on the higher timeframes), market participants feel comfortable, and the market is in a flat state. The British pound is still a currency that tends to move sideways, trading in a somewhat illogical and confusing manner.
As of February 23, we highlight the following important levels: 1.2215, 1.2269, 1.2349, 1.2429-1.2445, 1.2516, 1.2605-1.2620, 1.2726, 1.2786, 1.2863, 1.2981-1.2987. The Senkou Span B line (1.2613) and the Kijun-sen line (1.2628) lines can also serve as sources of signals. Don't forget to set a Stop Loss to breakeven if the price has moved in the intended direction by 20 pips. The Ichimoku indicator lines may move during the day, so this should be taken into account when determining trading signals.
On Friday, there are no important reports scheduled in the UK and the US. Thus, volatility may noticeably fall again. The British pound continues to move in all directions within the ongoing two-month flat. Movements are random, illogical, and difficult to predict.
Support and resistance levels are thick red lines near which the trend may end. They do not provide trading signals;
The Kijun-sen and Senkou Span B lines are the lines of the Ichimoku indicator, plotted to the 1H timeframe from the 4H one. They provide trading signals;
Extreme levels are thin red lines from which the price bounced earlier. They provide trading signals;
Yellow lines are trend lines, trend channels, and any other technical patterns;
Indicator 1 on the COT charts is the net position size for each category of traders;
Indicator 2 on the COT charts is the net position size for the Non-commercial group.
*यहां पर लिखा गया बाजार विश्लेषण आपकी जागरूकता बढ़ाने के लिए किया है, लेकिन व्यापार करने के लिए निर्देश देने के लिए नहीं |
InstaSpot analytical reviews will make you fully aware of market trends! Being an InstaSpot client, you are provided with a large number of free services for efficient trading.


