


InstaSpot टीम में लीजेंड!
लीजेंड! आपको लगता है कि धमाकेदार बयानबाजी है? लेकिन हमें एक आदमी को कैसे बुलाना चाहिए, जो 18 साल की जूनियर विश्व शतरंज चैंपियनशिप जीतने वाला पहला एशियाई बना और 19 में पहला भारतीय ग्रैंडमास्टर कौन बना? यह विश्वनाथन आनंद के लिए विश्व चैंपियन खिताब के लिए एक कठिन मार्ग की शुरुआत थी, जो उस व्यक्ति के लिए हमेशा के लिए शतरंज का इतिहास बन गया। अब InstaSpot टीम में एक और लीजेंड!


बोरूसिया जर्मनी में सबसे अधिक शीर्षक वाले फुटबॉल क्लबों में से एक है, जो प्रशंसकों के लिए बार-बार साबित हुआ है: प्रतियोगिता और नेतृत्व की भावना निश्चित रूप से सफलता की ओर ले जाएगी। उसी तरह से व्यापार जिसमें खेल पेशेवर खेल खेलते हैं: आत्मविश्वास से और सक्रिय रूप से। बोरूसिया FC से एक "पास" रखें और InstaSpot के साथ नेतृत्व में रहें!

EUR/USD finally showed notable movements. For the first time in a week, there were economic reports both in the United States, Germany and the European Union. We cannot consider them important, but they are still reports. In other words, when the market sits without significant events for three days, even business activity indices become super-important reports. And that's exactly what happened on Thursday.
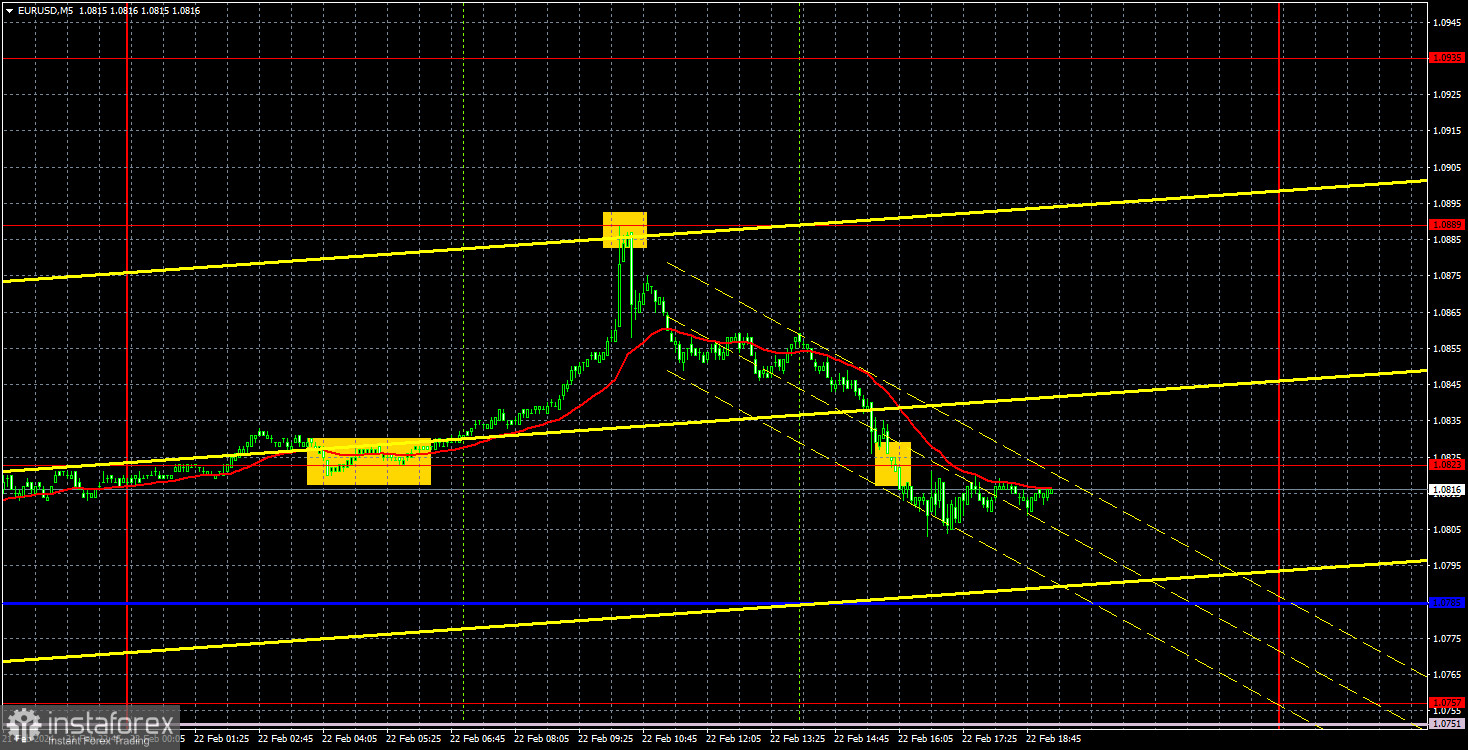
In fact, we did not see any resonant values. Some indices turned out to be slightly better than forecasts, some worse. The euro was supposed to fall, but in the end, it moved up and down. It seems that the market was just happy that it finally had a reason to trade more actively so it did not miss the opportunity to do so. Therefore, we saw a new phase of the upward movement within the upward correction. The trendline remains relevant, and yesterday the price bounced off it again. This means that the corrective phase may remain intact until the price breaks below the trendline. We expect the euro to fall, but for now, we have a correction.
The trading signals were excellent. As soon as the pair stopped standing still and showed good volatility, strong signals immediately formed. First, the price bounced off the level of 1.0823 (which served as a buy signal) and rose to the level of 1.0889. The pair reached the level of 1.0889, and then the price bounced off it, which should be interpreted as a sell signal. Therefore, traders could open short positions, and by the end of the day, the price reached the level of 1.0823 and even consolidated below it. Two trades, total profit - more than 80 pips.
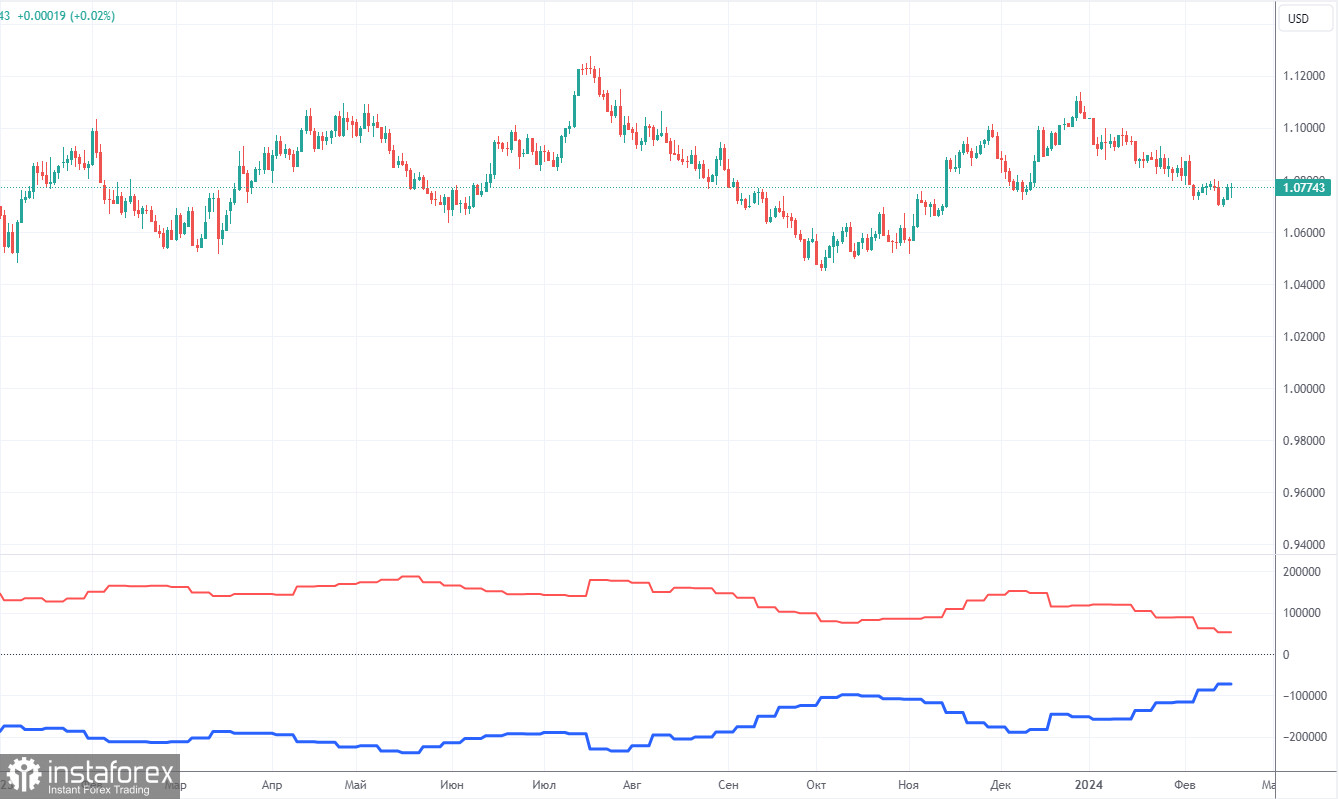
The latest COT report is dated February 13. The net position of non-commercial traders has been bullish for quite some time. The number of long positions is much higher than the number of short positions. In simpler terms, the number of long positions in the market is higher than the number of short positions. However, at the same time, the net position of non-commercial traders has been decreasing in recent months, while that of commercial traders has been increasing. This indicates a shift into a bearish bias, as speculators are building up short positions on the euro. We don't see any fundamental factors that can support the euro's growth in the long term, while technical analysis also signals the formation of a downtrend.
We have already drawn your attention to the fact that the red and blue lines have significantly diverged, often preceding the end of a trend. Currently, these lines are moving towards each other (indicating a trend reversal). Therefore, we believe that the euro will fall further. During the last reporting week, the number of long positions for the non-commercial group increased by 8,300, while the number of short positions increased by 17,700. Accordingly, the net position fell by 9,400. The number of buy contracts is still higher than the number of sell contracts among non-commercial traders by 52,000 (previously 63,000). Thus, commercial traders continue to sell the euro.
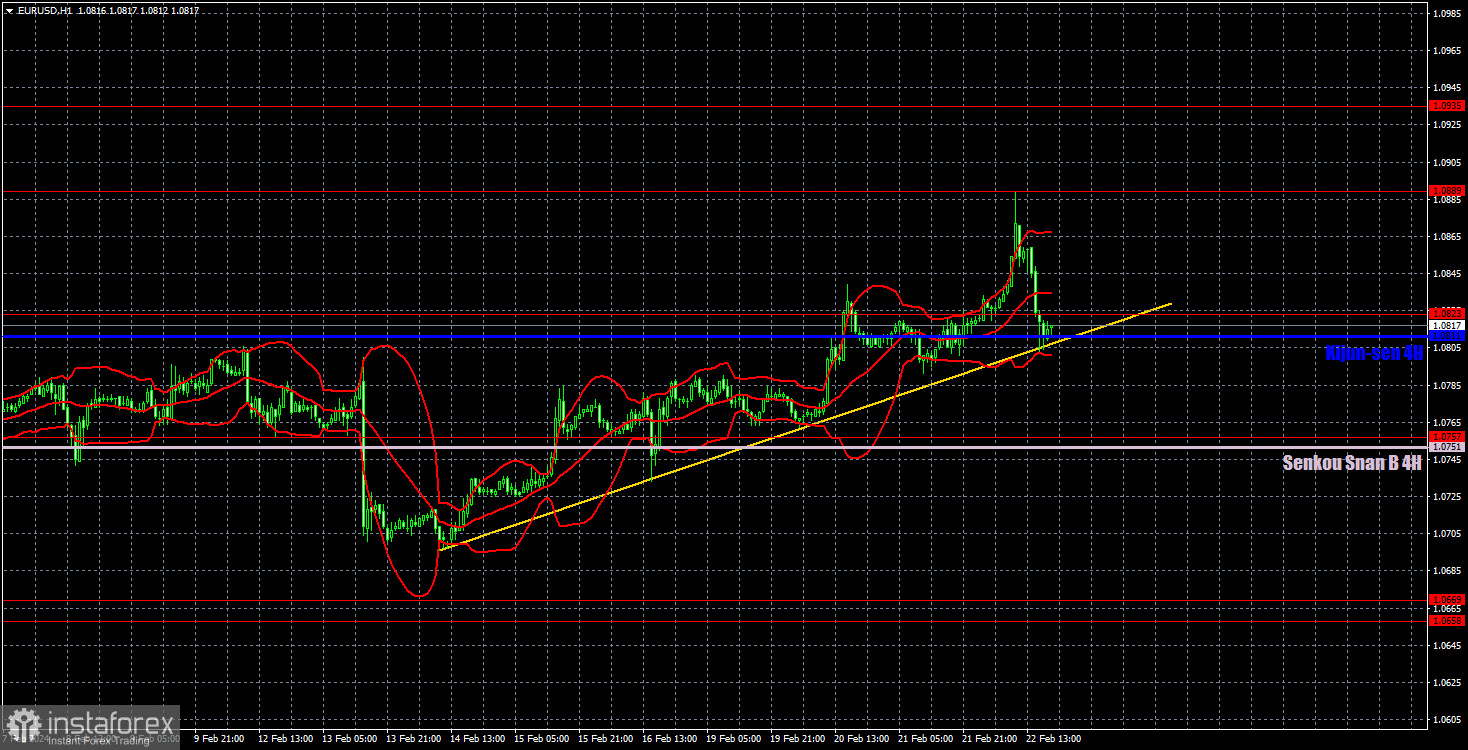
On the 1-hour chart, the uptrend remains intact, but we are skeptical about it. In our opinion, all the factors currently suggest that the dollar will strengthen. Therefore, we expect the price to consolidate below the trendline and the euro to revive the downward movement. The nearest target is the area of 1.0658-1.0669. However, until the correction ends, you may still consider small purchases, and expect the euro to trade higher.
On February 23, we highlight the following levels for trading: 1.0530, 1.0581, 1.0658-1.0669, 1.0757, 1.0823, 1,0889, 1.0935, 1.1006, 1.1092, as well as the Senkou Span B line (1.0751) and Kijun-sen (1.0811). The Ichimoku indicator lines can move during the day, so this should be taken into account when identifying trading signals. Don't forget to set a Stop Loss to breakeven if the price has moved in the intended direction by 15 pips. This will protect you against potential losses if the signal turns out to be false.
On Friday, there are no significant events planned. Traders can only pay attention to the final assessment of GDP in Germany for the fourth quarter and data from the IFO institute on business climate, current conditions, and investor expectations. All these are secondary data related to Germany.
Support and resistance levels are thick red lines near which the trend may end. They do not provide trading signals;
The Kijun-sen and Senkou Span B lines are the lines of the Ichimoku indicator, plotted to the 1H timeframe from the 4H one. They provide trading signals;
Extreme levels are thin red lines from which the price bounced earlier. They provide trading signals;
Yellow lines are trend lines, trend channels, and any other technical patterns;
Indicator 1 on the COT charts is the net position size for each category of traders;
Indicator 2 on the COT charts is the net position size for the Non-commercial group.
*यहां पर लिखा गया बाजार विश्लेषण आपकी जागरूकता बढ़ाने के लिए किया है, लेकिन व्यापार करने के लिए निर्देश देने के लिए नहीं |
InstaSpot analytical reviews will make you fully aware of market trends! Being an InstaSpot client, you are provided with a large number of free services for efficient trading.


