


The forex market begins the trading session with a mix of anticipation and caution. A weak performance in the Chinese stock market and mixed signals from European index futures set a somber tone for global investors. The U.S. dollar shows signs of strength as market participants brace for the latest economic data from the United States, especially the Q4 GDP figures for 2023, which remain the focal point for investors.
After a subdued session in China and consolidation on Wall Street, European index futures suggest a mixed start. While the economic calendar appears light in the early hours, the latter part of the day will draw investor attention toward the U.S. GDP readings. Initial data on the Q4 GDP for 2023 will be released, followed by several Federal Reserve officials' speeches.
Analysts expect the GDP report to affirm the robust growth of the U.S. economy in the last quarter of 2023, with a consensus forecast of a 3.3% year-over-year increase. The current base scenario priced in by investors assumes a soft landing of the U.S. economy; thus, a solid GDP report would only confirm this trajectory.
The GBP/USD pair is facing downward pressure on the 4-hour chart, characterized by a series of bearish engulfing patterns and a shooting star, all of which signal potential continuation of the current bearish trend. The currency pair is trading below the 100-period EMA and the 50-period DEMA, indicating that the bears have the upper hand for now.
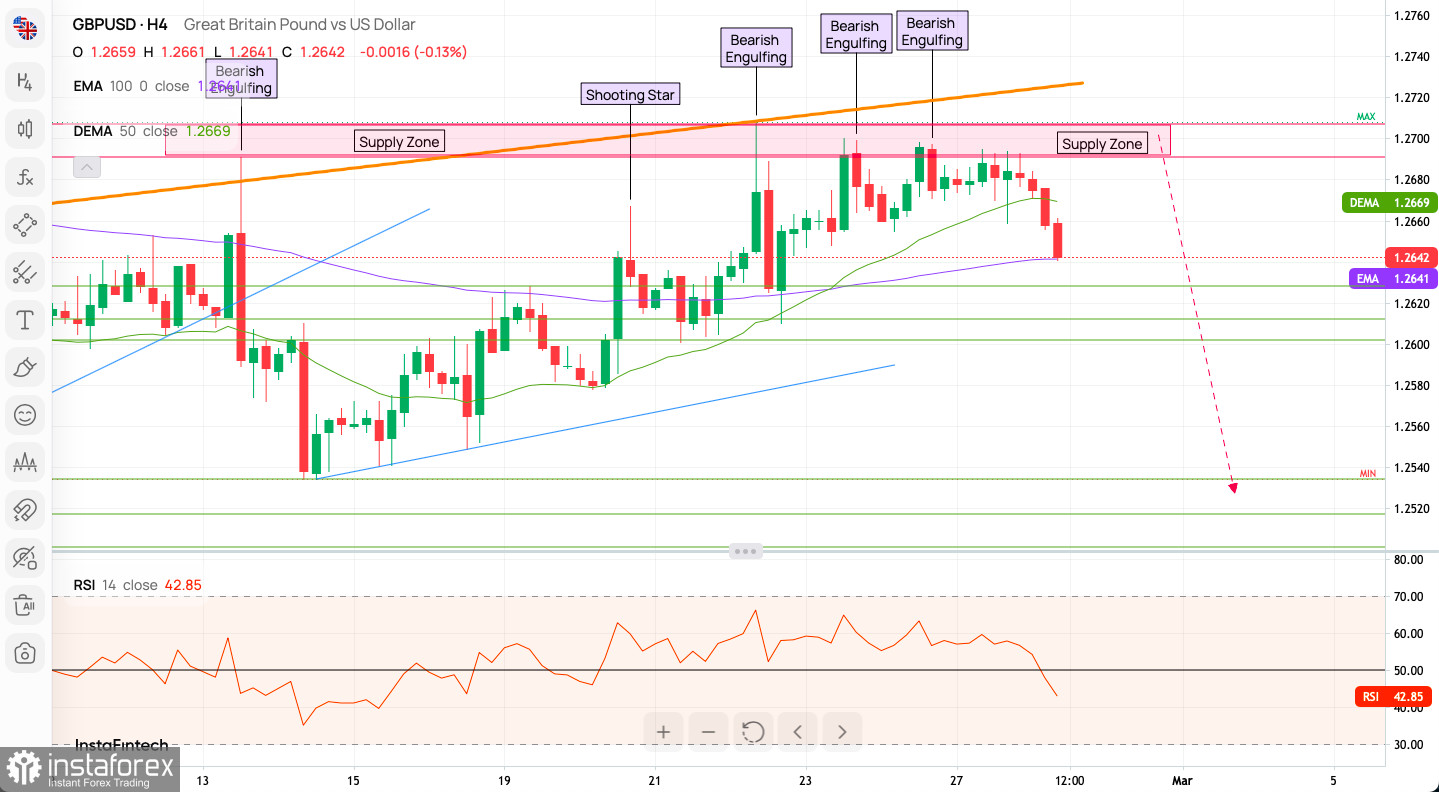
The RSI is lingering below the mid-point, which corroborates the bearish sentiment but also indicates that the market is not yet in an oversold state—there could be more room for the downside. Traders should eye the immediate support level at 1.2642 and the resistance levels at 1.2669 and the 100-period EMA for potential price pivots.
In summary, the technical indicators suggest bearish sentiment in the short term, with the potential for the downtrend to continue if the price stays below the supply zone and the moving averages. The presence of bearish candlestick patterns and the RSI's position support this view. However, the approach to the long-term ascending trend line and the 100-period EMA could provide a pivotal moment for the pair, with the potential for a bounce back if these levels hold as support. Traders should watch these key levels closely for signs of either a continued downtrend or a possible reversal if support holds.
The begginers in forex trading need to be very careful when making decisions about entering the market. Before the release of important reports, it is best to stay out of the market to avoid being caught in sharp market fluctuations due to increased volatility. If you decide to trade during the news release, then always place stop orders to minimize losses.
Without placing stop orders, you can very quickly lose your entire deposit, especially if you do not use money management and trade large volumes. For successful trading, you need to have a clear trading plan and stay focues and disciplined. Spontaneous trading decision based on the current market situation is an inherently losing strategy for a scalper or daytrader.
#instaforex #analysis #sebastianseliga
*यहां पर लिखा गया बाजार विश्लेषण आपकी जागरूकता बढ़ाने के लिए किया है, लेकिन व्यापार करने के लिए निर्देश देने के लिए नहीं |
InstaSpot analytical reviews will make you fully aware of market trends! Being an InstaSpot client, you are provided with a large number of free services for efficient trading.


