


InstaSpot टीम में लीजेंड!
लीजेंड! आपको लगता है कि धमाकेदार बयानबाजी है? लेकिन हमें एक आदमी को कैसे बुलाना चाहिए, जो 18 साल की जूनियर विश्व शतरंज चैंपियनशिप जीतने वाला पहला एशियाई बना और 19 में पहला भारतीय ग्रैंडमास्टर कौन बना? यह विश्वनाथन आनंद के लिए विश्व चैंपियन खिताब के लिए एक कठिन मार्ग की शुरुआत थी, जो उस व्यक्ति के लिए हमेशा के लिए शतरंज का इतिहास बन गया। अब InstaSpot टीम में एक और लीजेंड!


बोरूसिया जर्मनी में सबसे अधिक शीर्षक वाले फुटबॉल क्लबों में से एक है, जो प्रशंसकों के लिए बार-बार साबित हुआ है: प्रतियोगिता और नेतृत्व की भावना निश्चित रूप से सफलता की ओर ले जाएगी। उसी तरह से व्यापार जिसमें खेल पेशेवर खेल खेलते हैं: आत्मविश्वास से और सक्रिय रूप से। बोरूसिया FC से एक "पास" रखें और InstaSpot के साथ नेतृत्व में रहें!

The pace of industrial production growth in the United States has accelerated from 0.0% to 0.2%. However, despite this positive report, the U.S. dollar remained stable and even weakened slightly, despite expectations of growth. This can be explained by the fact that the market had already priced in this growth, and perhaps the dollar was overbought. Even though the report was more positive than expected, the dollar could not demonstrate significant strengthening due to its overbought condition.
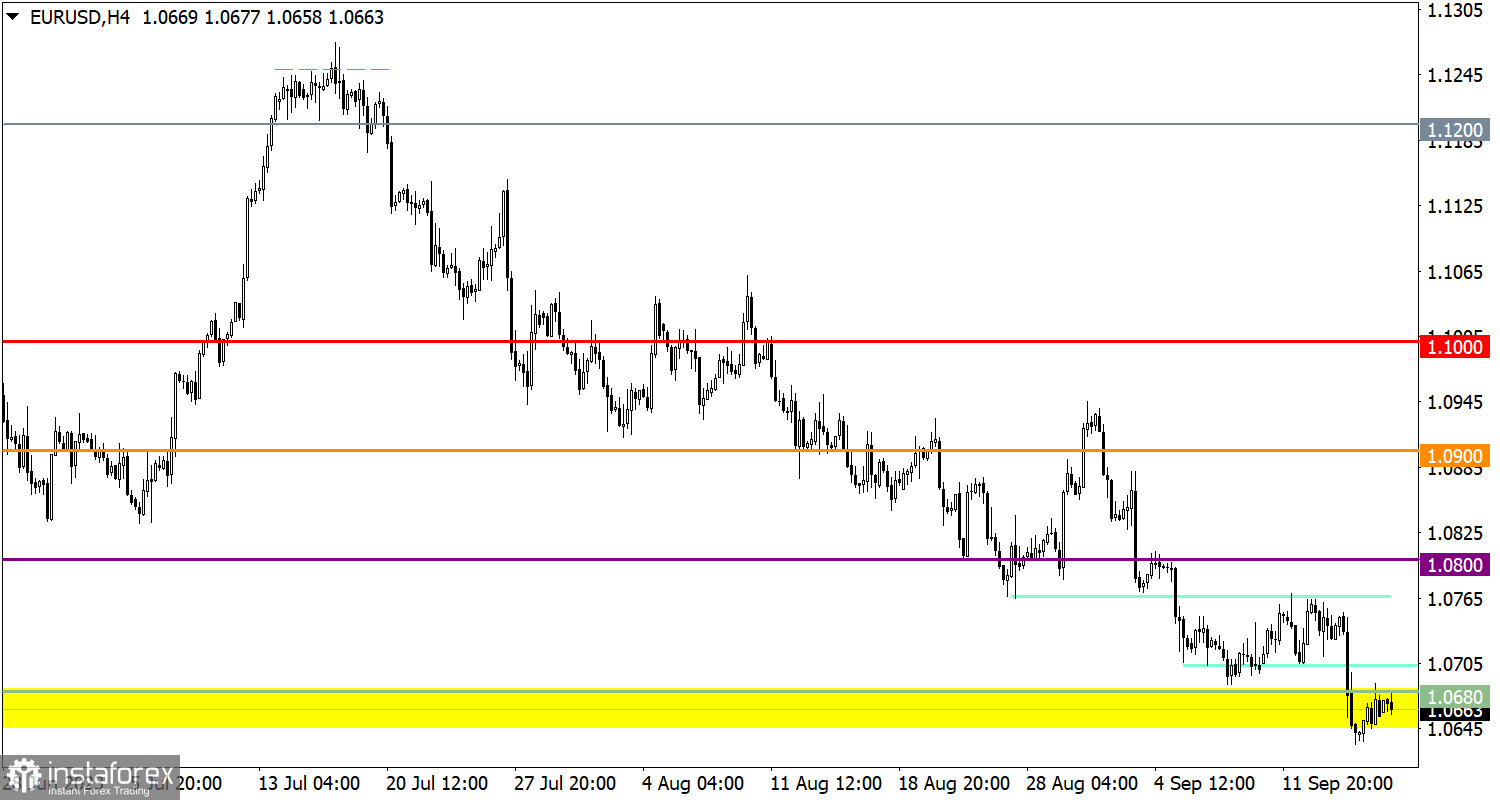
The EUR/USD currency pair returned to the area of the previously breached support in the range of 1.0650/1.0680 after a slight pullback. Several factors may explain this move, including an overheating of short positions on the euro and the breakout and pullback pattern often observed after the breach of important levels.
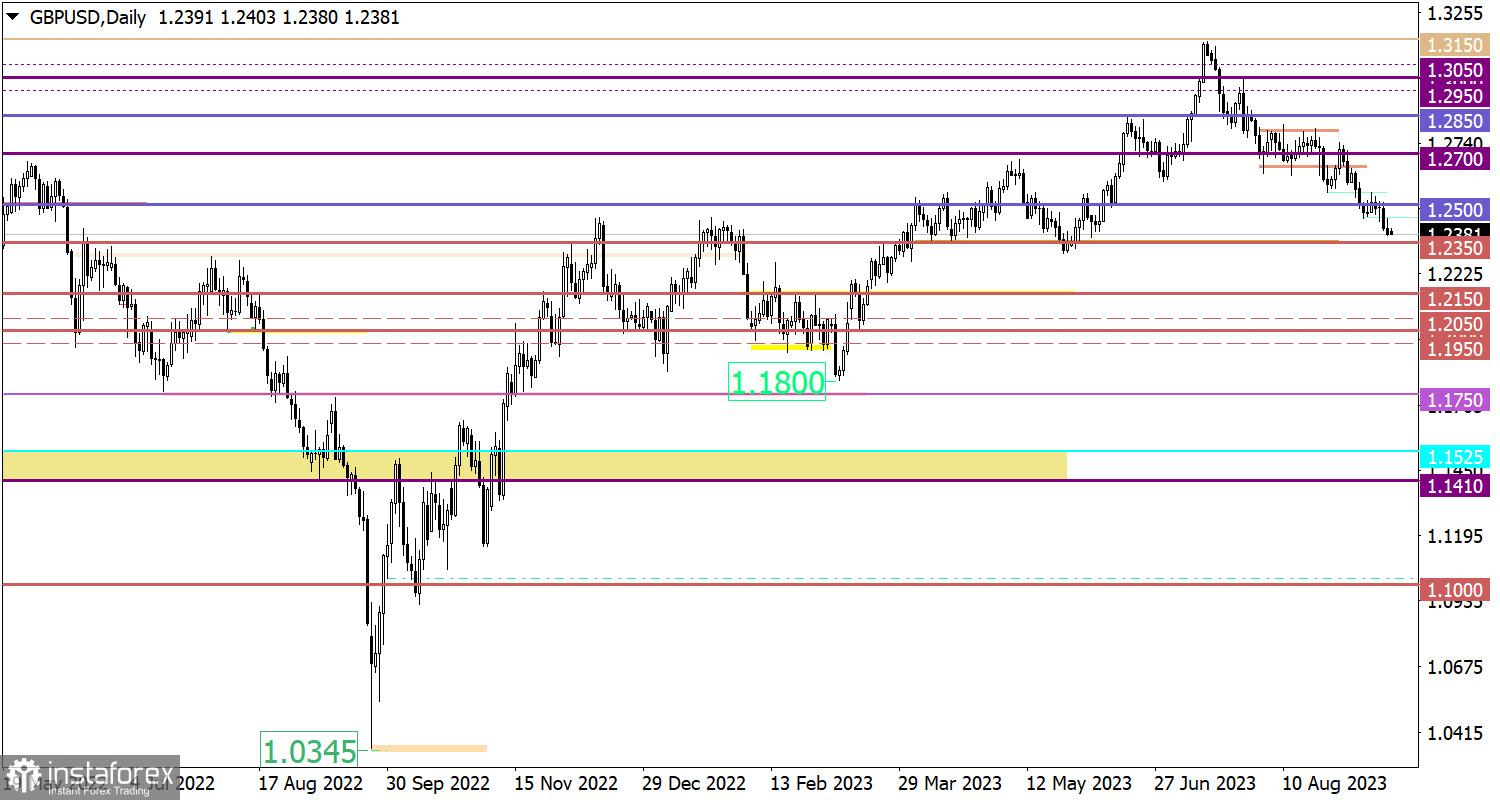
On the other hand, the British pound continues its downward cycle despite a technical signal of being oversold.

Monday, as usual, is accompanied by an empty macroeconomic calendar. There are no expected significant statistical data releases in the European Union, the United Kingdom, or the United States.
As a result, investors and traders are likely to rely on incoming news and information flows to make market decisions.
Sustained price action below the level of 1.0650 would increase the probability of further decline in the euro's exchange rate. However, the market still considers the euro to be oversold at the moment, and this could lead to a pullback and a stagnation in price dynamics.
The support level around 1.2350 could act as a barrier for sellers and trigger a reduction in short positions, which, in turn, could lead to a minor rebound and partial recovery of the British pound's exchange rate. However, for the continuation of the downward cycle and a change in medium-term trading interests, it is important for the price to remain below the level of 1.2300 during the daily period.
The candlestick chart type is white and black graphic rectangles with lines above and below. With a detailed analysis of each individual candle, you can see its characteristics relative to a particular time frame: opening price, closing price, intraday high and low.
Horizontal levels are price coordinates, relative to which a price may stop or reverse its trajectory. In the market, these levels are called support and resistance.
Circles and rectangles are highlighted examples where the price reversed in history. This color highlighting indicates horizontal lines that may put pressure on the asset's price in the future.
The up/down arrows are landmarks of the possible price direction in the future.
*यहां पर लिखा गया बाजार विश्लेषण आपकी जागरूकता बढ़ाने के लिए किया है, लेकिन व्यापार करने के लिए निर्देश देने के लिए नहीं |
InstaSpot analytical reviews will make you fully aware of market trends! Being an InstaSpot client, you are provided with a large number of free services for efficient trading.


