


Recent sessions on Wall Street ended on a high note, with Nasdaq100 gaining 3.01% and Nvidia shares jumping by 16.5%. This positive momentum carried over to Asia, particularly in Japan, where the Nikkei rose over 2%. However, Chinese indices closed flat despite the upbeat mood. In the housing market, China saw a 0.7% drop in new home prices, and Singapore's CPI indicated a 0.7% decline, contrasting with the previous increase.
In Europe, the futures contracts are slightly down, although the sentiment is buoyed by higher futures on Wall Street. The UK consumer sentiment dipped more than expected, which could weigh on the European currencies. Comments from the Fed's Lisa Cook and Patrick Harker suggest a near-term cut in interest rates, which aligns with market expectations for the second half of the year.
The EUR/USD is currently flat, trading around 1.0822, and the USD/JPY consistently holds above 150 points. Precious metals are losing ground except for palladium, while cryptocurrencies show negligible response to the Wall Street rally, with Bitcoin below $51,500. German insurer Allianz reported Q4 earnings that beat expectations, along with a €1 billion share buyback.
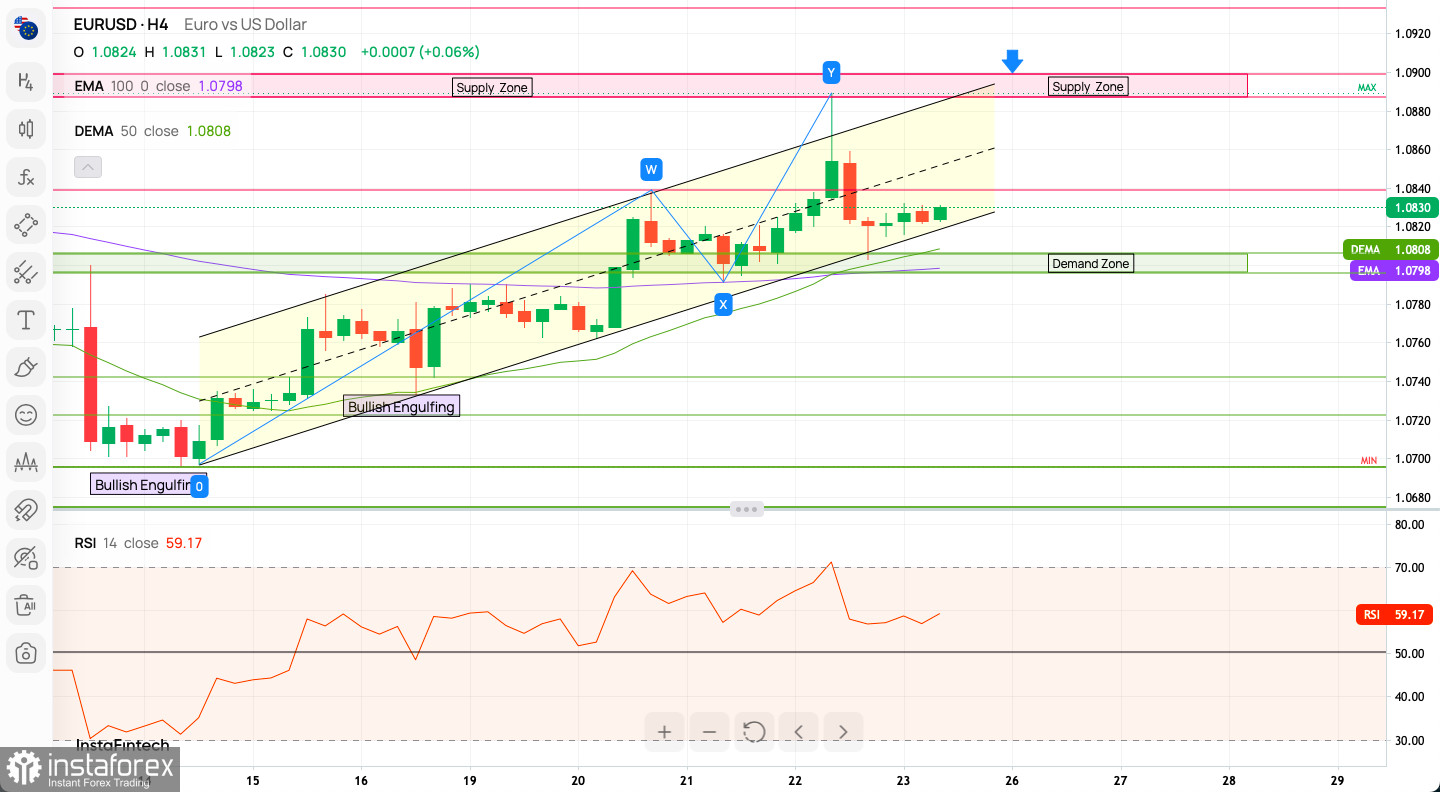
The EUR/USD H4 chart shows a clear bullish trend within an ascending channel, supported by 13 out of 18 moving averages signaling 'Buy'. The RSI is above the midpoint at 59.17, suggesting bullish momentum but not yet overbought. A bullish engulfing pattern indicates potential continuation of the uptrend, with the currency pair testing a supply zone near the 1.0920 mark.
Summary: The technical analysis of the EUR/USD pair suggests a continued bullish trend within the rising channel. The presence of bullish candlestick patterns and the price position relative to moving averages support this. However, the approaching resistance and the RSI's position suggest that traders should be cautious of potential pullbacks or consolidation.
Traffic Light Indicator:
Please remember, this analysis is based on the information provided in the chart and should not be taken as trading advice. Always do your due diligence before making any trading decisions.
If EUR/USD sustains its position above the Weekly Pivot Point (1.07824) and surpasses the WR1 (1.07902), we could expect a push towards the supply zone at 1.0821. A break above WR2 (1.07970) may strengthen the bullish case, possibly extending gains towards the WR3 (1.08116).
A drop below the Weekly Pivot Point could see the pair test the WS1 (1.07756) for support. If bearish momentum increases, falling below the DEMA 50 and WS2 (1.07678) could signal a more substantial shift in sentiment, with a potential move towards WS3 (1.07568) and possibly exiting the bullish channel.
The EUR/USD pair demonstrates resilience despite mixed fundamental signals. Traders should watch pivot points closely for directional cues and remain aware of global economic updates that may influence market sentiment.
The begginers in forex trading need to be very careful when making decisions about entering the market. Before the release of important reports, it is best to stay out of the market to avoid being caught in sharp market fluctuations due to increased volatility. If you decide to trade during the news release, then always place stop orders to minimize losses.
Without placing stop orders, you can very quickly lose your entire deposit, especially if you do not use money management and trade large volumes. For successful trading, you need to have a clear trading plan and stay focues and disciplined. Spontaneous trading decision based on the current market situation is an inherently losing strategy for a scalper or daytrader.
#instaforex #analysis #sebastianseliga
*यहां पर लिखा गया बाजार विश्लेषण आपकी जागरूकता बढ़ाने के लिए किया है, लेकिन व्यापार करने के लिए निर्देश देने के लिए नहीं |
InstaSpot analytical reviews will make you fully aware of market trends! Being an InstaSpot client, you are provided with a large number of free services for efficient trading.


