


हमारी टीम के पास 7,000,000 से अधिक ट्रेडर हैं!
प्रतिदिन हम ट्रेडिंग को बेहतर बनाने के लिए एक साथ काम करते हैं। हम उच्च परिणाम प्राप्त कर रहे हैं और आगे की ओर बढ़ रहे हैं।
दुनियाभर के लाखों लोगों द्वारा हमारे काम को पहचानना, हमारे काम की सबसे अच्छी सराहना है! आपने आपनी पसंद बनाई है और हम आपकी अपेक्षाओं को पूरा करने के लिए हर संभव प्रयास करेंगे!
हम एक साथ एक अच्छी टीम हैं!
इंस्टाफॉरेक्स को इस बात का गर्व है कि वह आपके लिए काम कर रहा है!


एक्टर, यूएफसी 6 टूर्नामेंट का विजेता और एक सच्चा हीरो!
वह आदमी, जिसने अपनी मेहनत से सब किया है। वह आदमी, जो हमारे रास्तों पर चलता है.
टैक्टारोव की सफलता का राज लक्ष्य की ओर लगातर अग्रसर रहना है।
अपनी प्रतिभा के सभी पक्षों को प्रकट करें!
खोज करें, कोशिश करें, विफल हो-लेकिन कभी न रूकें!
इंस्टाफॉरेक्स- हमारी सफलताओं की कहानी यहाँ से शुरू होती है!

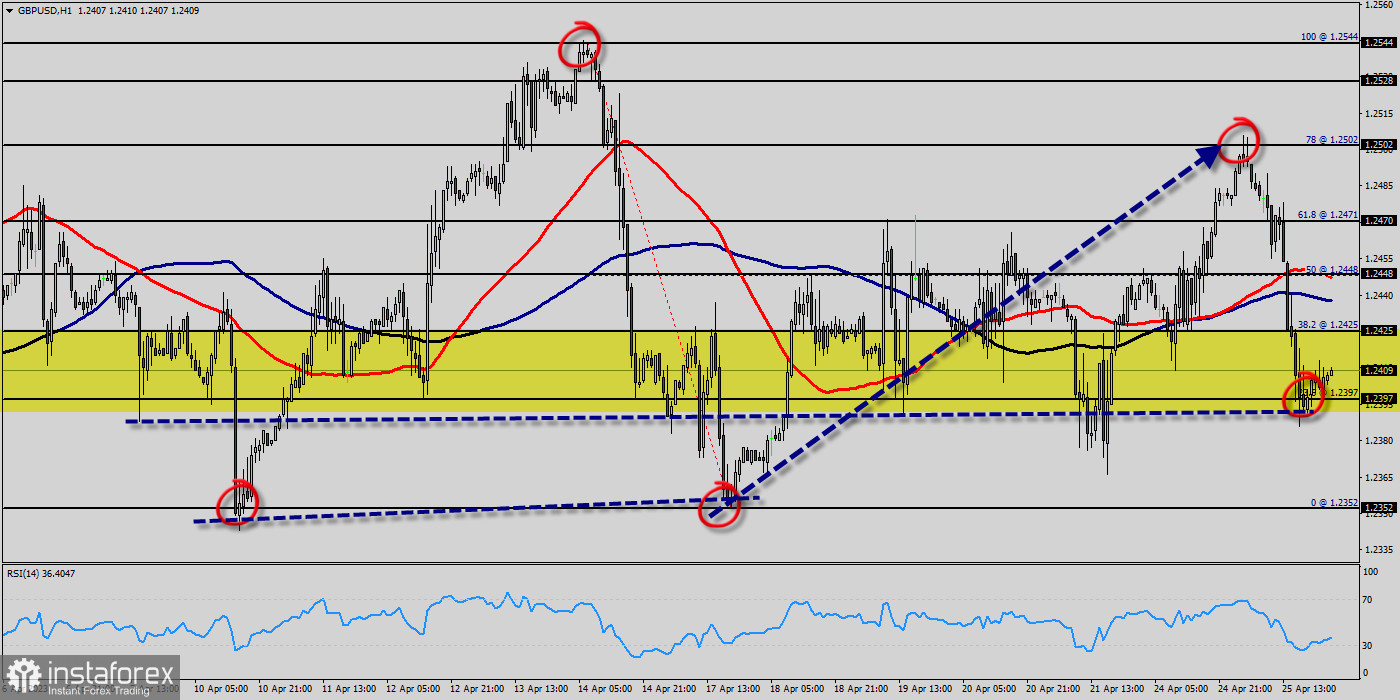
The bullish trend is currently very strong on The GBP/USD pair. As long as the price remains above the support levels of 1.2397, you could try to benefit from the growth. The first bullish objective is located at the price of 1.2425. The bullish momentum would be boosted by a break in this resistance (1.2425).
The hourly chart is currently still bullish. At the same time, some stabilization tendencies are visible between 1.2397 and 1.2035. Together with the relatively large distance to the fast-rising 100-day moving average (1.2035), there are some arguments for a relief rally in coming months on the table.
The GBP/USD pair is at highest against the dollar around the spot of 1.2035 since last week. The GBP/USD pair is inside in upward channel. For some weeks the GBP/USD pair decreased within an up channel, for that the GBP/USD pair its new highest 1.2067. Consequently, the first support is set at the level of 1.2035. Hence, the market is likely to show signs of a bullish trend around the area of 1.2000 and 1.2035.
RSI is seeing major support above 33% and a bullish divergence vs price also signals that a reversal is impending. According to the previous events the price is expected to remain between 1.2425 and 1.2397 levels. Buyers would then use the next resistance located at 1.2067 as an objective. Crossing it would then enable buyers to target 1.2502 (the double top - last bullish week).
Be careful, given the powerful bullish rally underway, excesses could lead to a possible correction in the short term. If this is the case, remember that trading against the trend may be riskier. It would seem more appropriate to wait for a signal indicating reversal of the trend. The GBP/USD pair has plunged up for a fresh two weeks high.
Prices pushed above a key retracement from a Fibonacci setup that spans from the lowest price of 1.2397 (23.6% of Fibonacci on the hourly chart), for that buyer pulled the bid back-above that level by the end of the week.
This week, the GBP/USD pair traded up and closed the day in the red area near the price of 1.2397. Today it rose a little, rising above 1.2397. If the pair succeeds in passing through the level of 1.2425, the market will indicate the bullish opportunity above the level of 1.2425 in order to reach the second target at 1.2501.
In the very short term, the general bullish sentiment is confirmed by technical indicators. Therefore, a small upwards rebound in the very short term could occur in case of excessive bearish movements. The trend is still bullish as long as the price of 1.2397 is not broken. Thereupon, it would be wise to re-buy above the price of at 1.2397 with the objective of 1.2352. We should see the pair climbing towards the next target of 1.2300. The pair will move upwards continuing the development of the bullish trend to the level 1.2501 or 1.2544 in coming days.
*यहां पर लिखा गया बाजार विश्लेषण आपकी जागरूकता बढ़ाने के लिए किया है, लेकिन व्यापार करने के लिए निर्देश देने के लिए नहीं |
InstaSpot analytical reviews will make you fully aware of market trends! Being an InstaSpot client, you are provided with a large number of free services for efficient trading.


