


Triple Top and Triple Bottom patterns
Triple top is reversal pattern consisting of three equal highs followed by a break below the support level.


Ο θρύλος στην ομάδα της InstaSpot!!
Θρύλος! Νομίζετε ότι είναι πομπώδης ρητορική; Αλλά πώς πρέπει να ονομάσουμε έναν άντρα, ο οποίος έγινε ο πρώτος Ασιάτης που κέρδισε το παγκόσμιο πρωτάθλημα σκακιού στα 18 και που έγινε ο πρώτος Ινδός Grandmaster στα 19; Αυτή ήταν η αρχή ενός σκληρού δρόμου για τον τίτλο του Παγκόσμιου Πρωταθλητή για τον Viswanathan Anand, τον άνθρωπο που έγινε μέρος της ιστορίας του σκακιού για πάντα. Τώρα ένας ακόμη θρύλος στην ομάδα της InstaSpot!


Η Μπορούσια είναι ένας από τους πιο σημαντικούς ποδοσφαιρικούς συλλόγους στη Γερμανία, που έχει αποδείξει επανειλημμένα στους οπαδούς: ότι το πνεύμα του ανταγωνισμού και της ηγεσίας σίγουρα θα οδηγήσει στην επιτυχία!
Πραγματοποιήστε συναλλαγές με τον ίδιο τρόπο που οι επαγγελματίες του αθλητισμού παίζουν στον αγώνα: με αυτοπεποίθηση και ενεργητικότητα. Παραδειγματιστείτε από την Borussia FC και πηγαίνετε στην κορυφή με την InstaSpot!


Triple top is reversal pattern consisting of three equal highs followed by a break below the support level.
The Triple Top and Triple Bottom patterns are the most effective and widely-used reversal formations. It is most appropriate to apply them at the moment of a trend reversal. The strategy is based on spotting a graphical figure at the moment when the price chart corresponds to the certain conditions.
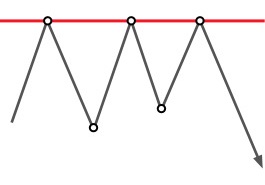
We see the Triple Top pattern on the chart. It indicates a trend reversal. A trader can make profits, paying attention to support and resistance levels. Both the Triple Top and the Triple Bottom patterns are easily noticed on a chart. They are formed on minute and hour time frames. Thanks to the fact that these figures are easy to recognize, a reversal tendency enables traders to make timely decisions on closing deals in the right direction.
The strategy based on the Triple Top pattern is applied when the market is bullish. The pattern forms when prices attempt to break the resistance level three times in a row. If this level is not broken, then prices move lower towards the previous support level (a neckline), i.e. the trend reverses.
Beginners often confuse the Triple Top with the Double Top which is formed when prices approach the resistance level two times. It is better to wait a bit longer and see exactly what figure was formed rather than to give inaccurate forecasts and lose money.
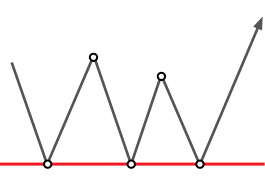
The Triple Bottom pattern is formed when the market is bearish. It indicates that the market is likely to reverse downwards in the nearest future. Sometimes this figure resembles a candlestick with a long shadow and a short body crossing the support line. Newbies may get worried over this sign, but such behavior of a candlestick indicates that bulls took control over the market. The best moment for buy entries is when a candlestick is crossed or when the price hits the third level. In this case, a trader should set target at the resistance level.
Peaks of all highs are located almost on the same level. At the moment when the price rebounds from highs, lows of the three bottoms also move lower by one horizontal. If you have noticed the Triple Top, wait for the price to slide and pass through the neckline. It will indicate that the upward trend will reverse, i.e. it will become downward.

