


Head And Shoulders pattern
The "Head and Shoulders" pattern is primarily a reversal pattern. This pattern is formed on the basis of 3 tops or 3 bottoms, moreover the middle top(bottom) higher than the other two.


Η ομάδα μας έχει πάνω από 7.000.000 επενδυτές!
Κάθε μέρα συνεργαζόμαστε για τη βελτίωση των συναλλαγών. Έχουμε υψηλά αποτελέσματα και προχωράμε.
Η αναγνώριση από εκατομμύρια επενδυτές σε όλο τον κόσμο είναι η καλύτερη εκτίμηση της δουλειάς μας! Κάνατε την επιλογή σας και θα κάνουμε ό,τι χρειάζεται για να ανταποκριθούμε στις προσδοκίες σας!
Είμαστε μια υπέροχη ομάδα μαζί!
InstaSpot. Υπερήφανοι που δουλεύουμε για εσάς!


Ηθοποιός, πρωταθλητής τουρνουά UFC 6 και πραγματικός ήρωας!
Ο άνθρωπος που τα κατάφερε. Ο άνθρωπος που ακολουθεί τον δρόμο μας..
Το μυστικό πίσω από την επιτυχία του Taktarov είναι η συνεχής κίνηση προς τον στόχο.
Αποκαλύψτε όλες τις πλευρές του ταλέντου σας!
Ανακαλύψτε, δοκιμάστε, αποτύχετε - αλλά μη σταματήσετε ποτέ!
InstaSpot. Η ιστορία επιτυχίας σας ξεκινά εδώ!


The "Head and Shoulders" pattern is primarily a reversal pattern. This pattern is formed on the basis of 3 tops or 3 bottoms, moreover the middle top(bottom) higher than the other two.
As a rule, novice traders are trying to find the popular Head And Shoulders pattern on trading charts. This model is described in almost all books on currency trading, experts write research papers about it, read lectures, etc. However, despite of the fact that this model is very popular, most traders identify it completely wrong and do not know how to apply it in trading.
Head and Shoulders is a trend reversal pattern. In other words, if you see this pattern, then after it is finally formed, the main trend, as a rule, partially or completely reverses. It means that the Head and Shoulders pattern is formed at highs or lows.
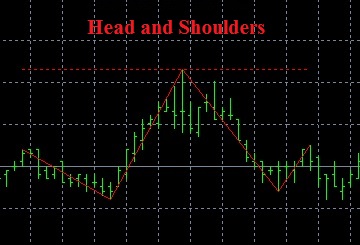
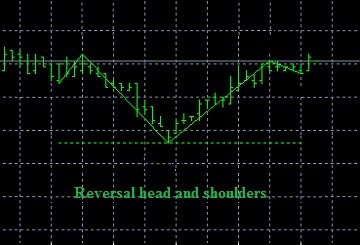
This pattern is formed on the basis of 3 peaks or 3 troughs.
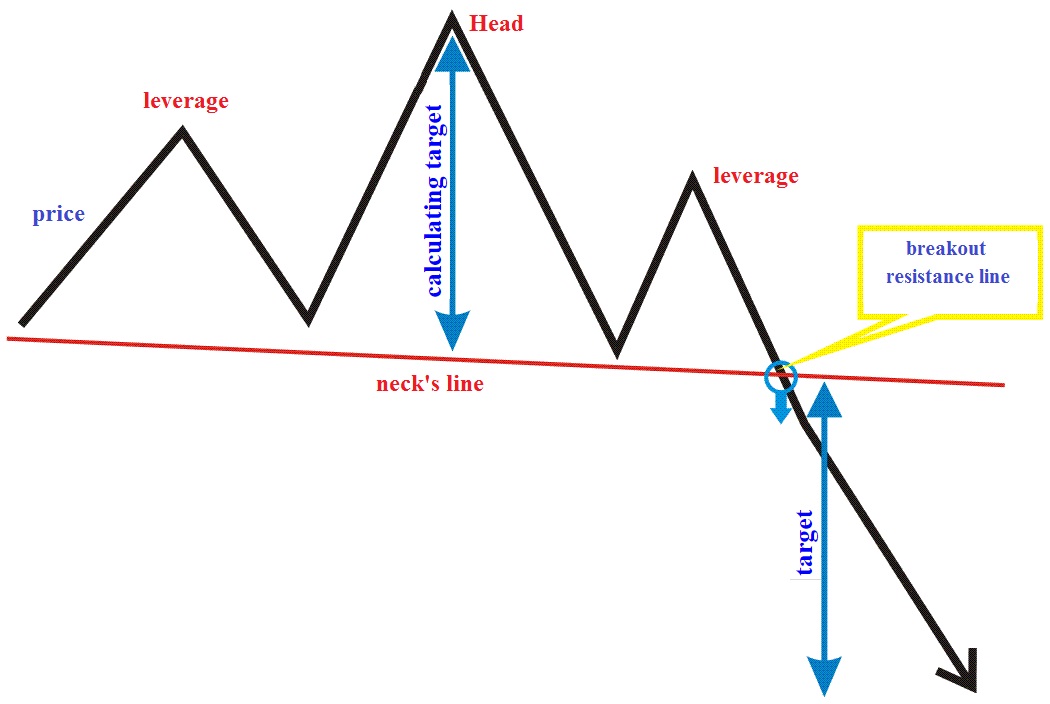
The reversal Head and Shoulders pattern is formed by 3 peaks, where the middle peak is higher than the other two. The right minimum of the middle peak (head) is located slightly higher than the left minimum of the peak. In other words, the neckline of the Head and Shoulders pattern should be slightly higher on the left side. Despite the fact that this condition is ideal for this model, there are cases when the neckline is horizontal, and sometimes even slightly inclined to the left side. These models also work, but the probability of failure is noticeably higher than for the standard Head and Shoulder patterns.
Let's analyze when it is the best time to enter and exit the market on the grounds of the Head and Shoulders pattern. As a rule, a break of the neckline is a clear sign to sell. In other words, closing the candle below the neckline is a signal to sell.
Our minimum target for take-profit is proportional to the distance from the middle peak (head) to the neckline. However, such reversal patterns quite often can yield a profit greater than the given distance. Therefore, when the set level of take profit is achieved, the best option is to close the deal partly and set the rest of the deal to a trailing stop or calculate new targets, for example, using the Fibonacci retracements.
Stop-loss must be set at least above the right shoulder for sell deals. In addition, the volume of trade is very important in the Head and Shoulders pattern.

