


Τα μοτίβα είναι γραφικά μοντέλα που σχηματίζονται στο γράφημα από την τιμή. Σύμφωνα με ένα από τα αξιώματα τεχνικής ανάλυσης, η ιστορία (μεταβολή των τιμών) επαναλαμβάνεται. Αυτό σημαίνει ότι οι μεταβολές των τιμών είναι συχνά παρόμοιες στις ίδιες καταστάσεις που καθιστούν δυνατή την πρόβλεψη της περαιτέρω εξέλιξης της κατάστασης με μεγάλη πιθανότητα.
Σχετικά μοτίβα από την InstaSpot είναι μια εύχρηστη υπηρεσία που σας επιτρέπει να γνωρίζετε τις τελευταίες αλλαγές στην αγορά και να αντιδράτε σε ενδείξεις από την αγορά στον χρόνο. Στην υπηρεσία μας θα βρείτε πάντα τα πιο πρόσφατα και πιο σχετικά μοτίβα σε οποιοδήποτε ζεύγος και οποιοδήποτε χρονικό πλαίσιο.
Bearish Rectangle
was formed on 10.04 at 14:40:41 (UTC+0)
signal strength 1 of 5
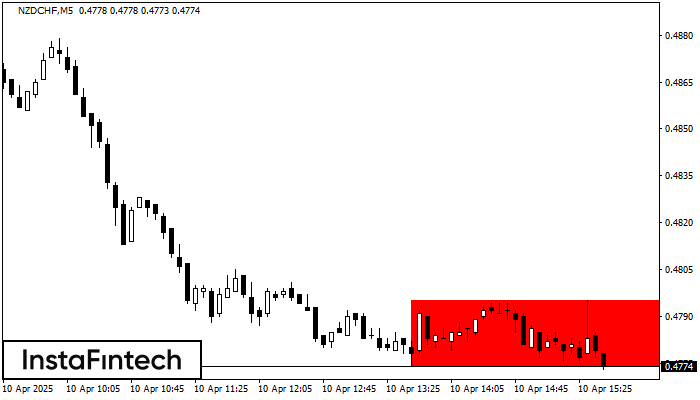
According to the chart of M5, NZDCHF formed the Bearish Rectangle. The pattern indicates a trend continuation. The upper border is 0.4795, the lower border is 0.4774. The signal means that a short position should be opened after fixing a price below the lower border 0.4774 of the Bearish Rectangle.
The M5 and M15 time frames may have more false entry points.

