


Aktuální formace

Formace jsou grafické modely, které jsou v grafu vytvořeny podle ceny. Podle jednoho z technických postulátů se historie (cenový pohyb) opakuje. Znamená to, že pohyby cen jsou často podobné ve stejných situacích, které umožňují předvídat další vývoj situace s vysokou pravděpodobností
Aktuální formace od společnosti InstaSpot jsou snadno použitelnou službou, které vám umožňují seznámit se s nejnovějšími změnami na trhu a reagovat na na správém trhu v reálném čase. V našich službách vždy najdete nejnovější a nejrelevantnější formace na jakémkoli páru a jakémkoli časovém rámci.
Bullish Symmetrical Triangle
was formed on 16.04 at 17:03:02 (UTC+0)
signal strength 3 of 5
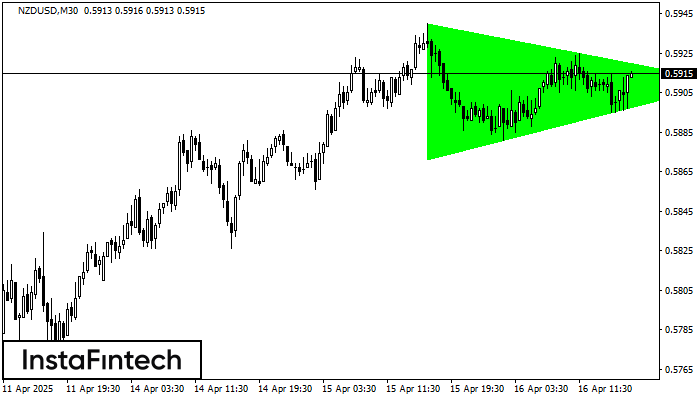
According to the chart of M30, NZDUSD formed the Bullish Symmetrical Triangle pattern. The lower border of the pattern touches the coordinates 0.5871/0.5910 whereas the upper border goes across 0.5940/0.5910. If the Bullish Symmetrical Triangle pattern is in progress, this evidently signals a further upward trend. In other words, in case the scenario comes true, the price of NZDUSD will breach the upper border to head for 0.5940.


