


Действителни модели

Моделите са графични схеми, които се формират върху ценовата графика. Според един от техническите анализи, историята (движението на цените) се повтаря. Това означава, че движенията на цените често са сходни в същите ситуации, което дава възможност да се предскаже по-нататъшното развитие на ситуацията с голяма вероятност.
Подходящите модели от ИнстаФорекс е лесна за използване услуга, която ви позволява да сте наясно с последните промени на пазара и да реагирате на знаците от пазара навреме. В нашата услуга винаги ще намерите най-новите и най-подходящите модели за всяка двойка и всяка времева рамка.
Bullish Symmetrical Triangle
was formed on 16.04 at 17:03:02 (UTC+0)
signal strength 3 of 5
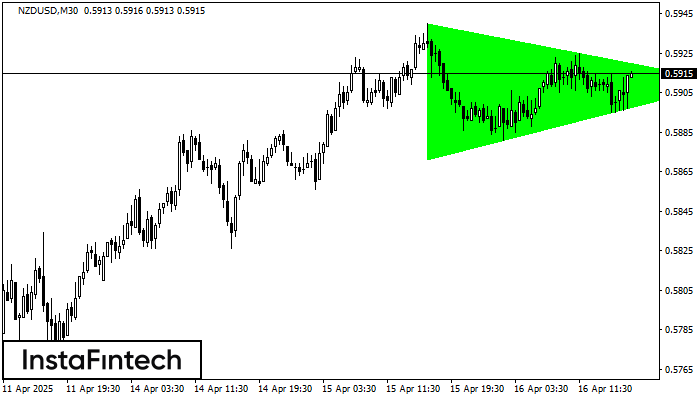
According to the chart of M30, NZDUSD formed the Bullish Symmetrical Triangle pattern. The lower border of the pattern touches the coordinates 0.5871/0.5910 whereas the upper border goes across 0.5940/0.5910. If the Bullish Symmetrical Triangle pattern is in progress, this evidently signals a further upward trend. In other words, in case the scenario comes true, the price of NZDUSD will breach the upper border to head for 0.5940.


