


الأسطورة فى فريق إنستافوركس!
الأسطورة! هل تعتقد أن هذا هو الخطاب المنمق؟ ولكن كيف ينبغي أن نطلق على الرجل، الذي أصبح أول آسيوي يفوز ببطولة العالم للشطرنج للشباب بعمر 18 سنة والذي أصبح أول أستاذ كبير هندي في سن 19؟ وكانت هذه بداية طريق صعب إلى لقب بطل العالم لـ فيسواناثان أناند، الرجل الذي أصبح جزءًا من تاريخ الشطرنج إلى الأبد. والآن أسطورة آخر في فريق إنستافوركس!


يعتبر بوروسيا دورتموند أحد أكثر أندية كرة القدم حصولاً على الألقاب في ألمانيا، وقد أثبت ذلك مرارًا وتكرارًا للجماهير: فإنّ روح المنافسة والقيادة ستؤدي بالتأكيد إلى النجاح. قم بالتداول بنفس الطريقة التي يلعب بها المحترفون الرياضيون اللعبة: بثقة ونشاط. احتفظ بـ "ترخيص دخول" من نادي بوروسيا دورتموند لكرة القدم وكن في الصدارة مع إنستافوركس!
Trend analysis (Fig. 1)
GBP/USD may continue its upward movement, rising from the level of 1.2720 (closing of yesterday's daily candle) and testing the historical resistance level of 1.2797 (blue dashed line). Upon reaching this, the pair may bounce back to the support line at 1.2779 (thick blue line).
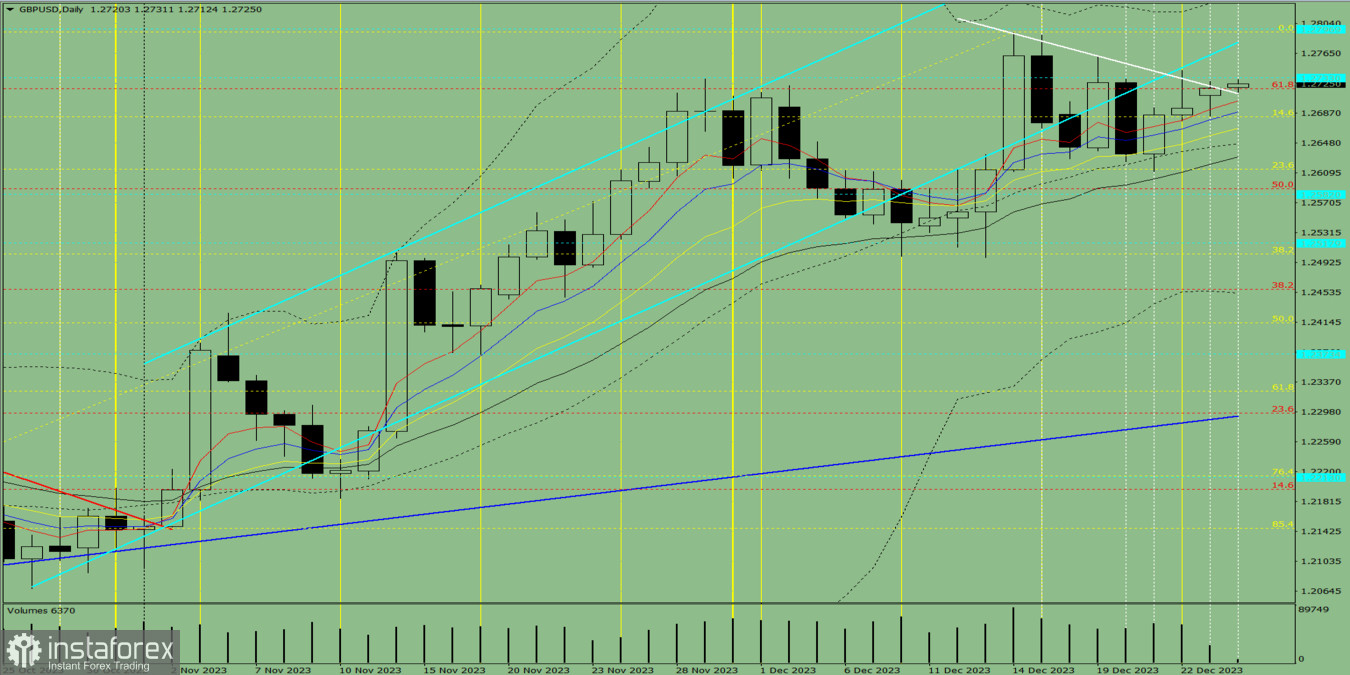
Fig. 1 (daily chart)
Comprehensive analysis:
Indicator analysis - uptrend
Fibonacci levels - uptrend
Volume - uptrend
Candlestick analysis - downtrend
Trend analysis - uptrend
Bollinger bands - uptrend
Weekly chart - uptrend
Conclusion: From the level of 1.2720 (closing of yesterday's daily candle), GBP/USD will climb upwards and test the historical resistance level of 1.2797 (blue dashed line). After this could be a rebound to the support line at 1.2779 (thick blue line).
Alternatively, there may be a rise from 1.2720 (closing of yesterday's daily candle) to the resistance line at 1.2779 (thick blue line), followed by a decline to the historical support level of 1.2733 (blue dashed line).
*The market analysis posted here is meant to increase your awareness, but not to give instructions to make a trade.
InstaSpot analytical reviews will make you fully aware of market trends! Being an InstaSpot client, you are provided with a large number of free services for efficient trading.


