


الأسطورة فى فريق إنستافوركس!
الأسطورة! هل تعتقد أن هذا هو الخطاب المنمق؟ ولكن كيف ينبغي أن نطلق على الرجل، الذي أصبح أول آسيوي يفوز ببطولة العالم للشطرنج للشباب بعمر 18 سنة والذي أصبح أول أستاذ كبير هندي في سن 19؟ وكانت هذه بداية طريق صعب إلى لقب بطل العالم لـ فيسواناثان أناند، الرجل الذي أصبح جزءًا من تاريخ الشطرنج إلى الأبد. والآن أسطورة آخر في فريق إنستافوركس!


يعتبر بوروسيا دورتموند أحد أكثر أندية كرة القدم حصولاً على الألقاب في ألمانيا، وقد أثبت ذلك مرارًا وتكرارًا للجماهير: فإنّ روح المنافسة والقيادة ستؤدي بالتأكيد إلى النجاح. قم بالتداول بنفس الطريقة التي يلعب بها المحترفون الرياضيون اللعبة: بثقة ونشاط. احتفظ بـ "ترخيص دخول" من نادي بوروسيا دورتموند لكرة القدم وكن في الصدارة مع إنستافوركس!
Bitcoin
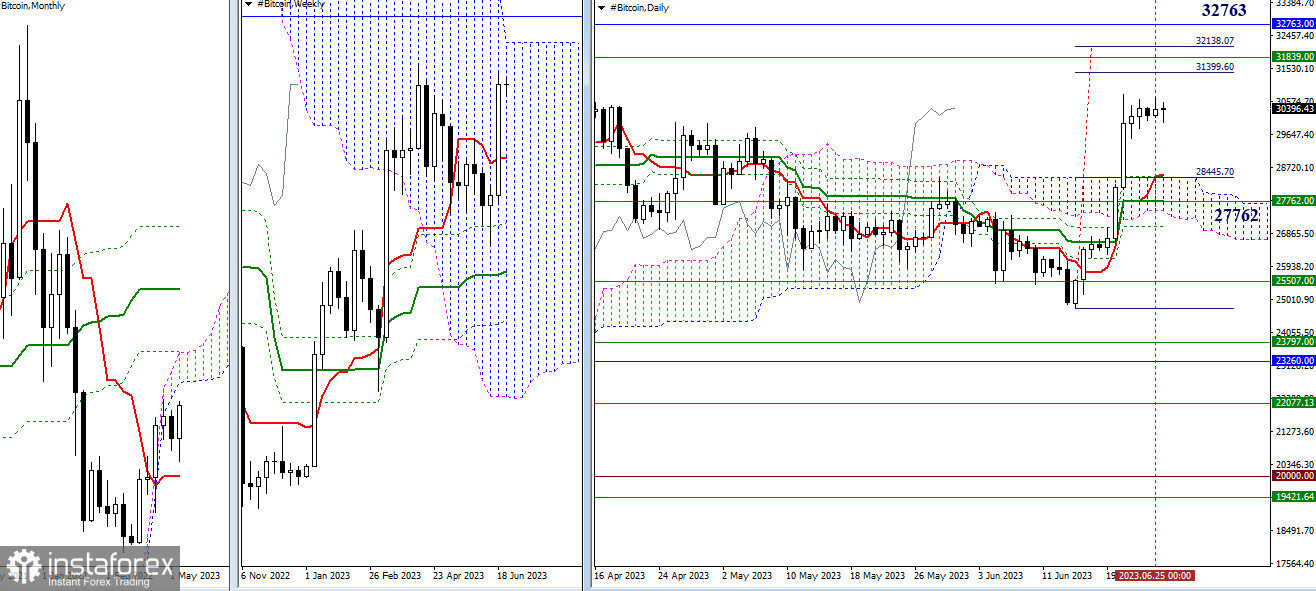
Higher timeframes
As June nears its end, bulls attempt to overcome the pause of the past few months and regain their positions. The nearest bullish targets on this path can be identified as the all-time high (31,044), the daily target for breaking the cloud (31,400 - 32,138), the upper boundary of the weekly cloud (31,839), and the lower boundary of the monthly cloud (32,763). Overcoming this cluster of levels, which are different in strength and significance, will create new prospects. If bulls face another failure and the immediate resistances cannot be overcome, bearish sentiments will return to the market.
In such case, the focus will primarily be on breaking the daily cloud (28,439 - 27,502) and the liquidation of the daily golden cross (27,052). The daily levels are currently reinforced by the weekly short-term trend (27,762), so if bears manage to pass the daily obstacles, they will gain control of the weekly short-term trend as well. After implementing one of the possible scenarios and surpassing the mentioned targets, the situation will need to be reassessed.
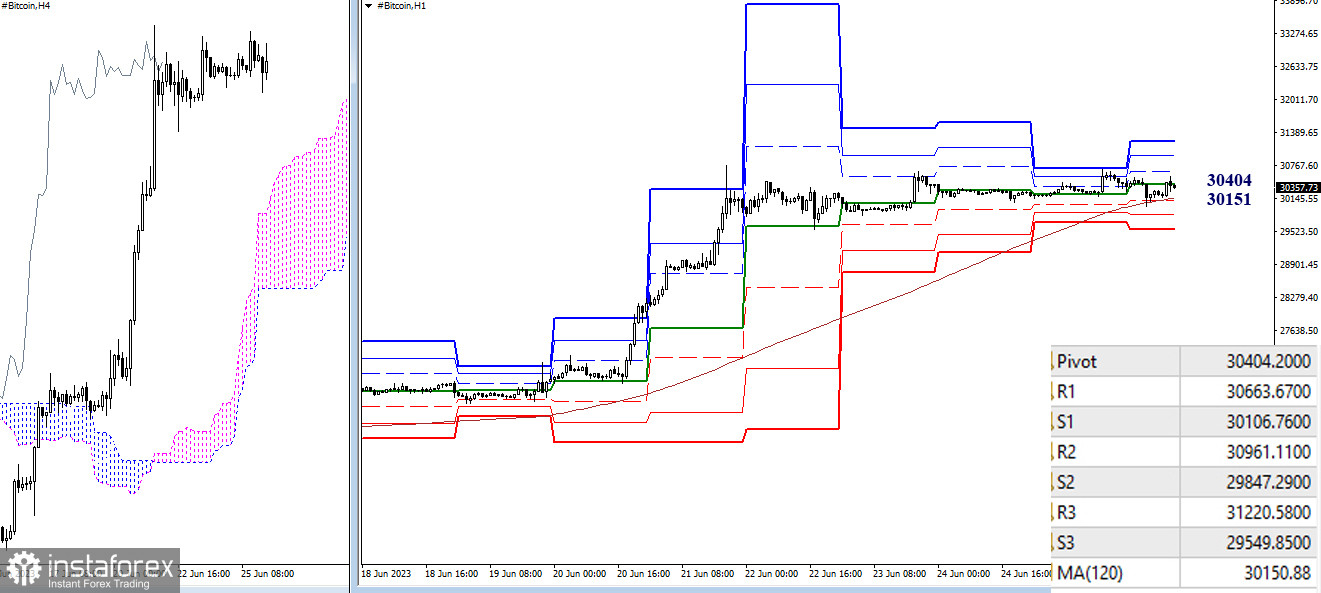
H4 - H1
After an active rise, the pair is now trading sideways, with the central pivot point of the day (30,404) becoming the center of attraction on the lower timeframes. It should be noted that the main level of the lower timeframes (weekly long-term trend) has been rising to meet the price chart every day, and today they intersected. As a result, breaking the weekly long-term trend (30,151) and a reversal of the moving average can change the current balance of power on the lower timeframes in favor of strengthening bearish sentiments. Additional reference points for intraday movement are the classic pivot points. Today they are located at 30,107 - 29,847 - 29,550 (support) and 30,664 - 30,961 - 31,221 (resistance).
The technical analysis of the situation uses:
Higher timeframes - Ichimoku Kinko Hyo (9.26.52) + Fibo Kijun levels
H1 - Pivot Points (classic) + Moving Average 120 (weekly long-term trend)
*The market analysis posted here is meant to increase your awareness, but not to give instructions to make a trade.
InstaSpot analytical reviews will make you fully aware of market trends! Being an InstaSpot client, you are provided with a large number of free services for efficient trading.


