


فريقنا لديه أكثر من 7,000,000 من التجار!
كل يوم نعمل معا لتحسين التداول. نحصل على نتائج عالية ونمضي قدما.
الاعتراف من قبل الملايين من التجار في جميع أنحاء العالم هو أفضل تقدير لعملنا! لقد قمت باختيارك وسنفعل كل ما يلزم لتلبية توقعاتك!
نحن فريق رائع معا!
إنستافوركس تعتز بالعمل بالنسبة لك!


الممثل وبطل مسابقة يو إف سي 6 وبطل حقيقي!
الرجل الذي حقق النجاح بعمله الدؤوب. الرجل الذي يذهب كما نريد.
سر نجاح تاكتاروف هو حركة مستمرة نحو الهدف.
اكشف عن جميع جوانب موهبتك!
اكتشف، وحاول، وافشل - ولكن لا تتوقف أبدا!
إنستافوركس. تبدأ قصة نجاحك من هنا!
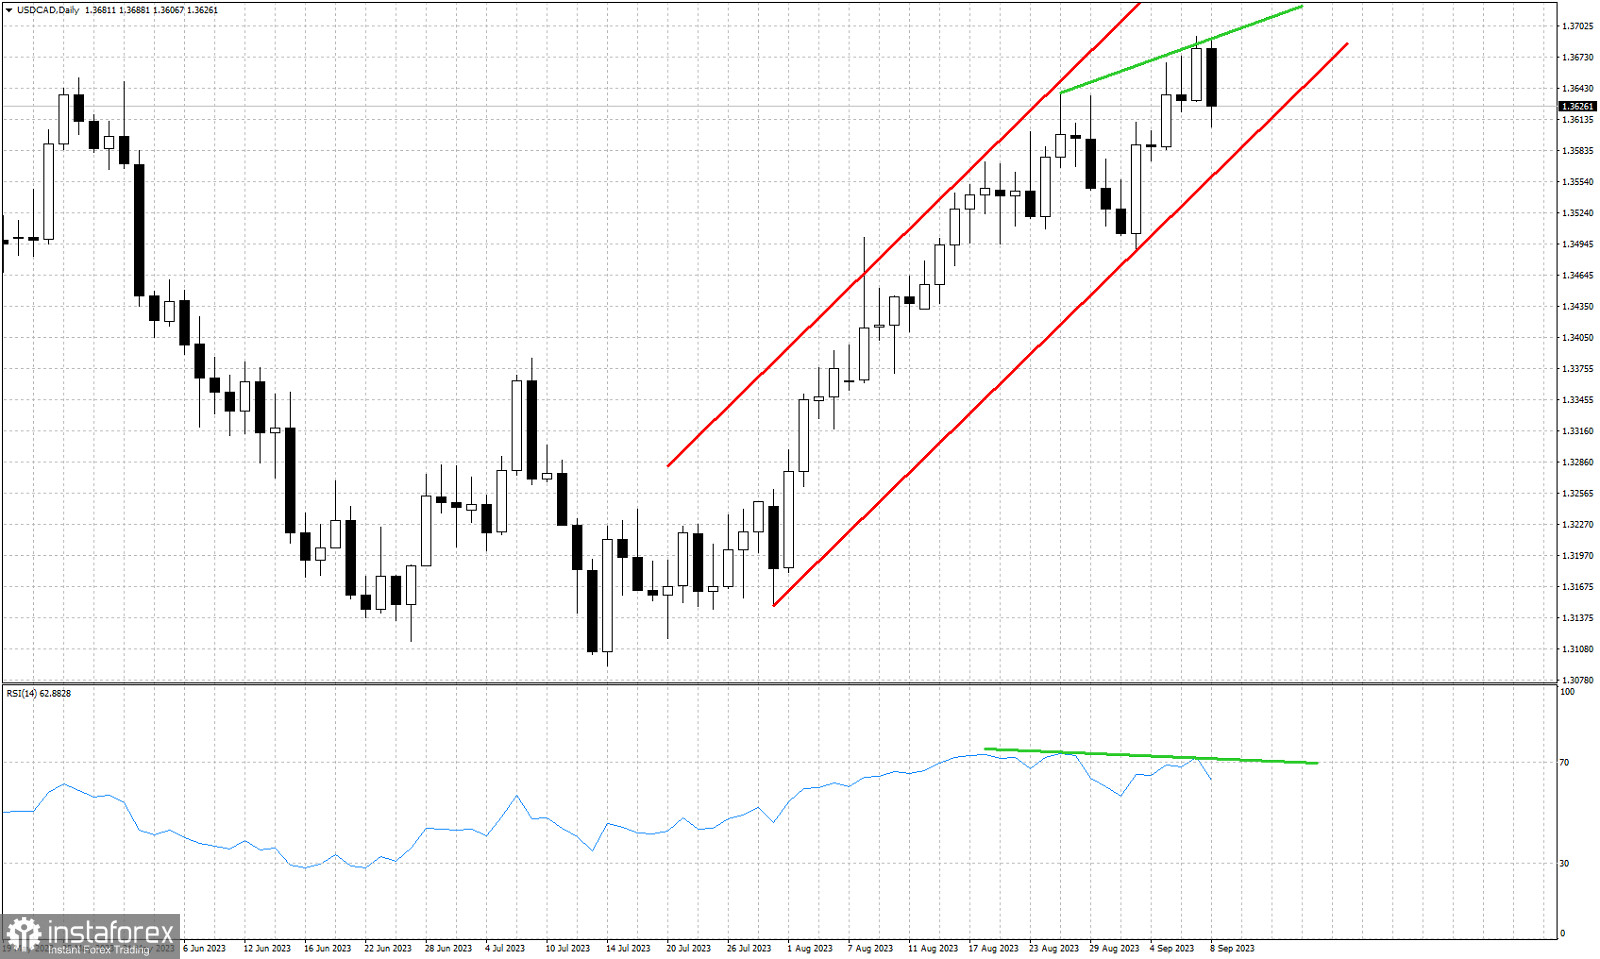
Green lines- bearish RSI divergence
Red lines- bullish channel
USDCAD remains technically in a bullish trend making higher highs and higher lows. Price remains inside the bullish channel but today price is under pressure. Despite the new higher high yesterday, the RSI did not follow and made a lower high. This bearish divergence is a warning sign for bulls. This is not a reversal signal but a sign of weakness. USDCAD is vulnerable to a move lower towards the lower channel boundary. At 1.3560 we find the lower channel boundary which provides support. At current levels we prefer to be neutral if not bearish.
*The market analysis posted here is meant to increase your awareness, but not to give instructions to make a trade.
InstaSpot analytical reviews will make you fully aware of market trends! Being an InstaSpot client, you are provided with a large number of free services for efficient trading.


