


فريقنا لديه أكثر من 7,000,000 من التجار!
كل يوم نعمل معا لتحسين التداول. نحصل على نتائج عالية ونمضي قدما.
الاعتراف من قبل الملايين من التجار في جميع أنحاء العالم هو أفضل تقدير لعملنا! لقد قمت باختيارك وسنفعل كل ما يلزم لتلبية توقعاتك!
نحن فريق رائع معا!
إنستافوركس تعتز بالعمل بالنسبة لك!


الممثل وبطل مسابقة يو إف سي 6 وبطل حقيقي!
الرجل الذي حقق النجاح بعمله الدؤوب. الرجل الذي يذهب كما نريد.
سر نجاح تاكتاروف هو حركة مستمرة نحو الهدف.
اكشف عن جميع جوانب موهبتك!
اكتشف، وحاول، وافشل - ولكن لا تتوقف أبدا!
إنستافوركس. تبدأ قصة نجاحك من هنا!
trend analysis
GBP/USD may start moving upward this week, starting from the closing of last week's candle at 1.2044 to the upper fractal at 1.2446 (yellow dotted line). Upon testing this level, the pair will head towards the historical resistance level at 1.2499 (blue dotted line).
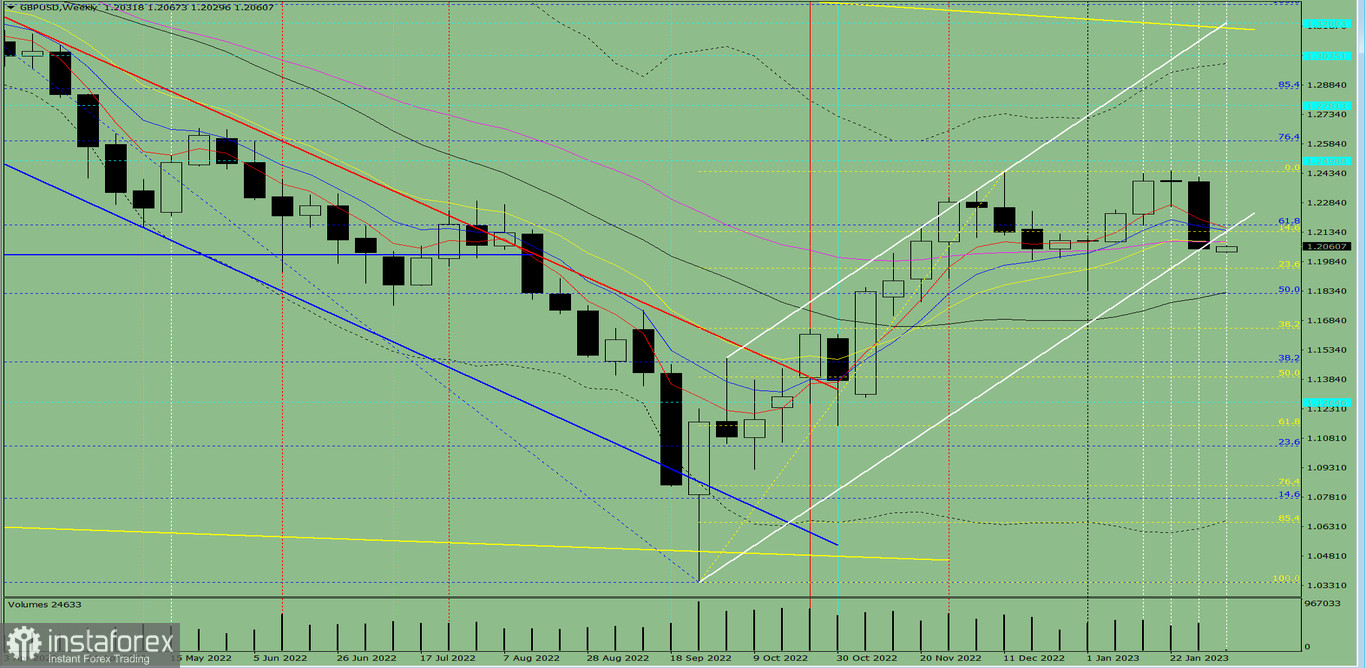
Fig. 1 (weekly chart)
Comprehensive analysis:
Indicator analysis - uptrend
Fibonacci levels - uptrend
Volumes - uptrend
Candlestick analysis - uptrend
Trend analysis - uptrend
Bollinger bands - uptrend
Monthly chart - uptrend
All these point to an upward movement in GBP/USD.
Conclusion: The pair will have a bullish trend, with no first lower shadow on the weekly white candle (Monday - up) and a second upper shadow (Friday - down).
So during the week, pound will fall from 1.2044 (closing of last week's candle) to the upper fractal at 1.2446 (yellow dotted line) and then head towards the historical resistance level at 1.2499 (blue dotted line).
Alternatively, quotes could dip from 1.2044 (closing of last week's candle) to the 23.6% retracement level at 1.1949 (yellow dotted line), then bounce up to the upper fractal at 1.2446 (yellow dotted line).
*The market analysis posted here is meant to increase your awareness, but not to give instructions to make a trade.
InstaSpot analytical reviews will make you fully aware of market trends! Being an InstaSpot client, you are provided with a large number of free services for efficient trading.


