


الأسطورة فى فريق إنستافوركس!
الأسطورة! هل تعتقد أن هذا هو الخطاب المنمق؟ ولكن كيف ينبغي أن نطلق على الرجل، الذي أصبح أول آسيوي يفوز ببطولة العالم للشطرنج للشباب بعمر 18 سنة والذي أصبح أول أستاذ كبير هندي في سن 19؟ وكانت هذه بداية طريق صعب إلى لقب بطل العالم لـ فيسواناثان أناند، الرجل الذي أصبح جزءًا من تاريخ الشطرنج إلى الأبد. والآن أسطورة آخر في فريق إنستافوركس!


يعتبر بوروسيا دورتموند أحد أكثر أندية كرة القدم حصولاً على الألقاب في ألمانيا، وقد أثبت ذلك مرارًا وتكرارًا للجماهير: فإنّ روح المنافسة والقيادة ستؤدي بالتأكيد إلى النجاح. قم بالتداول بنفس الطريقة التي يلعب بها المحترفون الرياضيون اللعبة: بثقة ونشاط. احتفظ بـ "ترخيص دخول" من نادي بوروسيا دورتموند لكرة القدم وكن في الصدارة مع إنستافوركس!
Trend analysis
EUR/USD may continue its downward movement this week, from the level of 1.0794 (closing of the last weekly candle) to the 23.6% retracement level of 1.0679 (blue dotted line). But once this price is reached, the pair will resume climbing up.
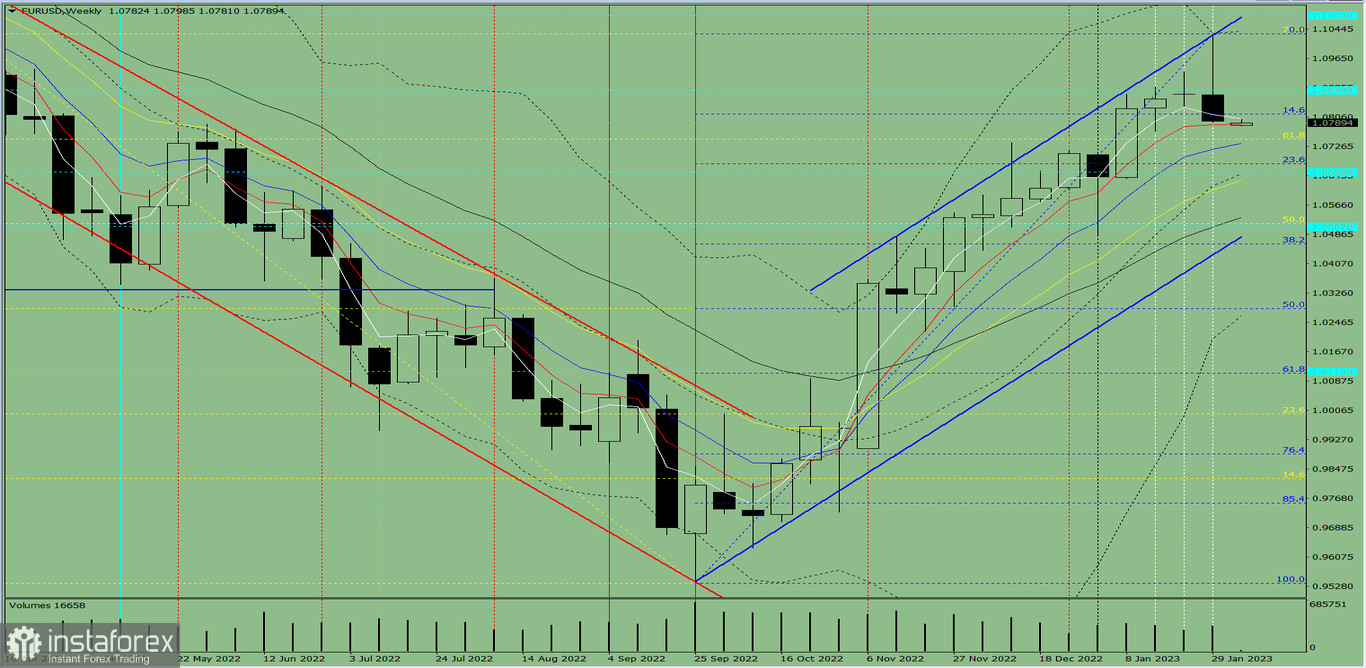
Fig. 1 (weekly chart)
Comprehensive analysis:
Indicator analysis - downtrend
Fibonacci levels - downtrend
Volumes - downtrend
Candlestick analysis - downtrend
Trend analysis - downtrend
Bollinger bands - downtrend
Monthly chart - downtrend
All these point to a downward movement in EUR/USD.
Conclusion: The pair will have a bearish trend, with no first upper shadow on the weekly black candle (Monday - down) and no second lower shadow (Friday - down).
So during the week, euro will fall from 1.0794 (closing of the last weekly candle) to the 23.6% retracement level of 1.0679 (blue dotted line), then bounce back to higher price levels.
Alternatively, the quote may dip from 1.0794 (closing of the last weekly candle) to the 13 EMA at 1.0634 (blue dotted line), and then resume an upward movement.
*The market analysis posted here is meant to increase your awareness, but not to give instructions to make a trade.
InstaSpot analytical reviews will make you fully aware of market trends! Being an InstaSpot client, you are provided with a large number of free services for efficient trading.


