


الأسطورة فى فريق إنستافوركس!
الأسطورة! هل تعتقد أن هذا هو الخطاب المنمق؟ ولكن كيف ينبغي أن نطلق على الرجل، الذي أصبح أول آسيوي يفوز ببطولة العالم للشطرنج للشباب بعمر 18 سنة والذي أصبح أول أستاذ كبير هندي في سن 19؟ وكانت هذه بداية طريق صعب إلى لقب بطل العالم لـ فيسواناثان أناند، الرجل الذي أصبح جزءًا من تاريخ الشطرنج إلى الأبد. والآن أسطورة آخر في فريق إنستافوركس!


يعتبر بوروسيا دورتموند أحد أكثر أندية كرة القدم حصولاً على الألقاب في ألمانيا، وقد أثبت ذلك مرارًا وتكرارًا للجماهير: فإنّ روح المنافسة والقيادة ستؤدي بالتأكيد إلى النجاح. قم بالتداول بنفس الطريقة التي يلعب بها المحترفون الرياضيون اللعبة: بثقة ونشاط. احتفظ بـ "ترخيص دخول" من نادي بوروسيا دورتموند لكرة القدم وكن في الصدارة مع إنستافوركس!
Ripple changed little in the short term but the bias remains bearish. Temporary rebounds or sideways movements could bring us new short opportunities. It's trading at 0.4247 at the time of writing.
Bitcoin's sell-off forced the altcoin to erase some of today's gains. In the last 24 hours, Ripple is up by 1.34% but it's down by 8.26% in the last 7 days. BTC/USD's deeper drop should push XRP/USD towards new lows.
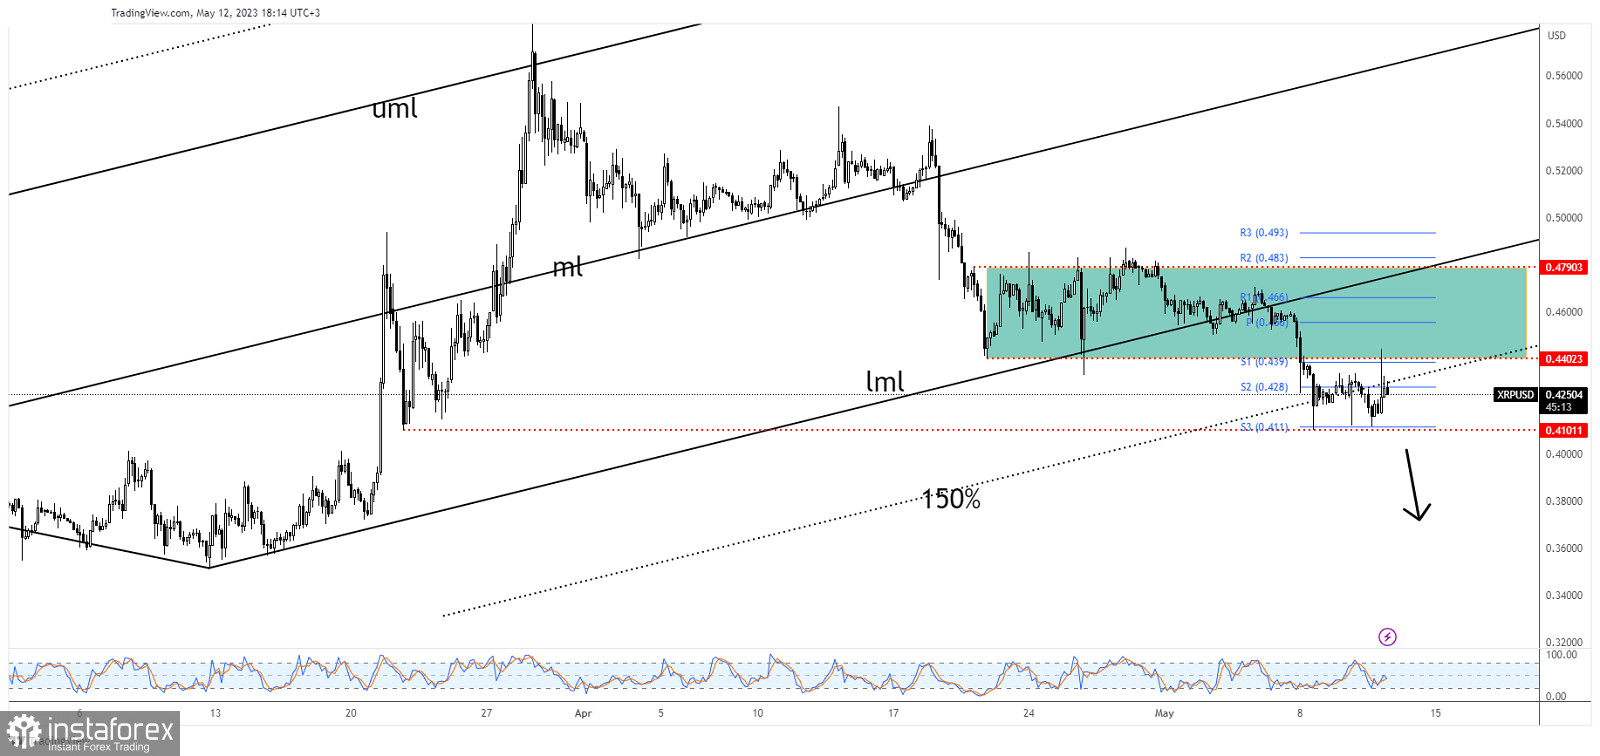
The XRP/USD found support above 0.4101 and it has tried to rebound. It has tested and retested the broken 150% Fibonacci line. As you can see on the H4 chart, Ripple registered false breakouts through the immediate resistance levels signaling strong sellers.
It's trapped between the weekly S2 (0.4280) and S3 (0.4110) levels. The current range could represent a downside continuation pattern.
A valid breakdown below 0.4101 validates more declines. This represents a bearish signal.
*The market analysis posted here is meant to increase your awareness, but not to give instructions to make a trade.
InstaSpot analytical reviews will make you fully aware of market trends! Being an InstaSpot client, you are provided with a large number of free services for efficient trading.


