


الأسطورة فى فريق إنستافوركس!
الأسطورة! هل تعتقد أن هذا هو الخطاب المنمق؟ ولكن كيف ينبغي أن نطلق على الرجل، الذي أصبح أول آسيوي يفوز ببطولة العالم للشطرنج للشباب بعمر 18 سنة والذي أصبح أول أستاذ كبير هندي في سن 19؟ وكانت هذه بداية طريق صعب إلى لقب بطل العالم لـ فيسواناثان أناند، الرجل الذي أصبح جزءًا من تاريخ الشطرنج إلى الأبد. والآن أسطورة آخر في فريق إنستافوركس!


يعتبر بوروسيا دورتموند أحد أكثر أندية كرة القدم حصولاً على الألقاب في ألمانيا، وقد أثبت ذلك مرارًا وتكرارًا للجماهير: فإنّ روح المنافسة والقيادة ستؤدي بالتأكيد إلى النجاح. قم بالتداول بنفس الطريقة التي يلعب بها المحترفون الرياضيون اللعبة: بثقة ونشاط. احتفظ بـ "ترخيص دخول" من نادي بوروسيا دورتموند لكرة القدم وكن في الصدارة مع إنستافوركس!
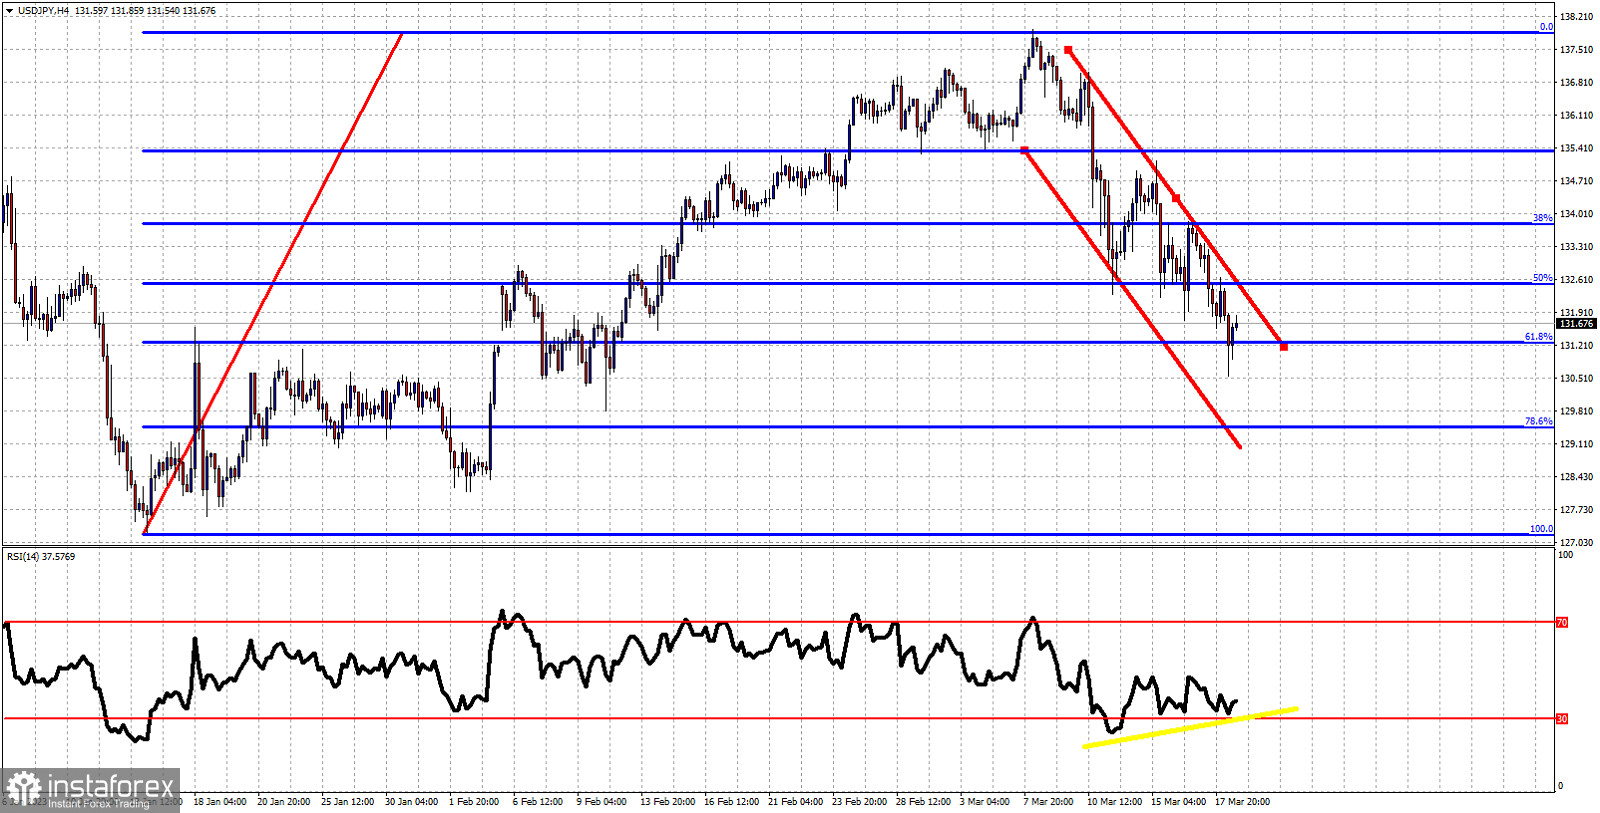
Yellow line- bullish divergence
Blue lines- Fibonacci retracements
Red lines- bearish channel
USDJPY is trading around 131.60. Short-term trend remains bearish. Price continues making lower lows and lower highs. Price is still inside the downward sloping red channel. As long as this is the case, trend will remain bearish. Price has now reached an important Fibonacci retracement level. Price has retraced 61.8% of the entire rise. The decline has so far paused at the 61.8% retracement level. At this retracement level we usually see trend reversals. The RSI has been making higher lows providing us with bullish divergence. Resistance by the channel is at 132.47. The combination of a bullish divergence in the RSI and a bounce off the 61.8% retracement level, increase chances of a reversal. If such a bounce will come and price breaks out of the bearish channel, then we should confirm that a low is in.
*The market analysis posted here is meant to increase your awareness, but not to give instructions to make a trade.
InstaSpot analytical reviews will make you fully aware of market trends! Being an InstaSpot client, you are provided with a large number of free services for efficient trading.


