


فريقنا لديه أكثر من 7,000,000 من التجار!
كل يوم نعمل معا لتحسين التداول. نحصل على نتائج عالية ونمضي قدما.
الاعتراف من قبل الملايين من التجار في جميع أنحاء العالم هو أفضل تقدير لعملنا! لقد قمت باختيارك وسنفعل كل ما يلزم لتلبية توقعاتك!
نحن فريق رائع معا!
إنستافوركس تعتز بالعمل بالنسبة لك!


الممثل وبطل مسابقة يو إف سي 6 وبطل حقيقي!
الرجل الذي حقق النجاح بعمله الدؤوب. الرجل الذي يذهب كما نريد.
سر نجاح تاكتاروف هو حركة مستمرة نحو الهدف.
اكشف عن جميع جوانب موهبتك!
اكتشف، وحاول، وافشل - ولكن لا تتوقف أبدا!
إنستافوركس. تبدأ قصة نجاحك من هنا!

Market participants as a whole reacted rather restrainedly to the decision of the central bank to raise the interest rate and to today's speech of the head of the RBA, and the publication of minutes from the June meeting of the bank.
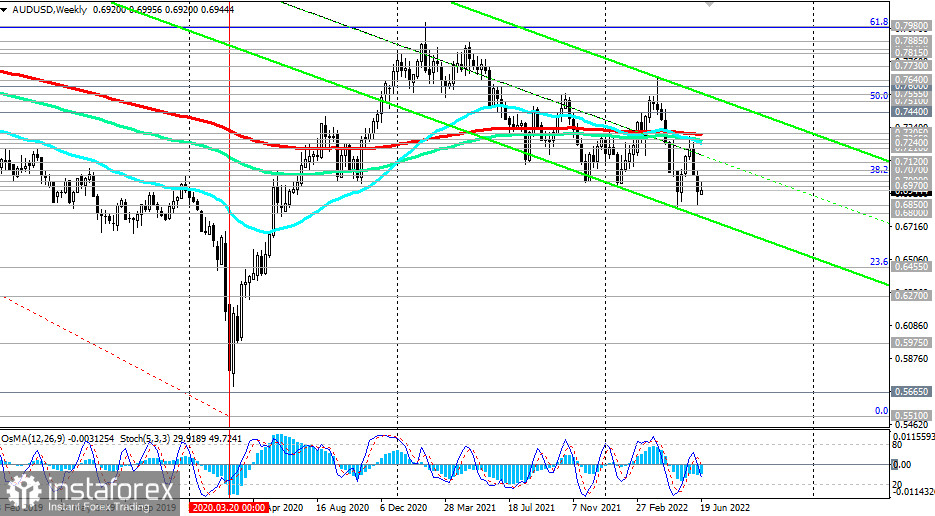
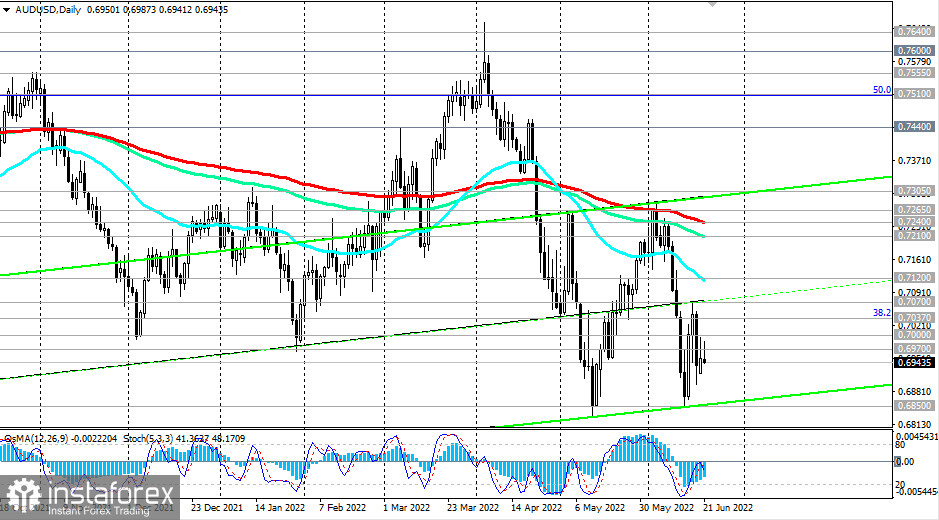
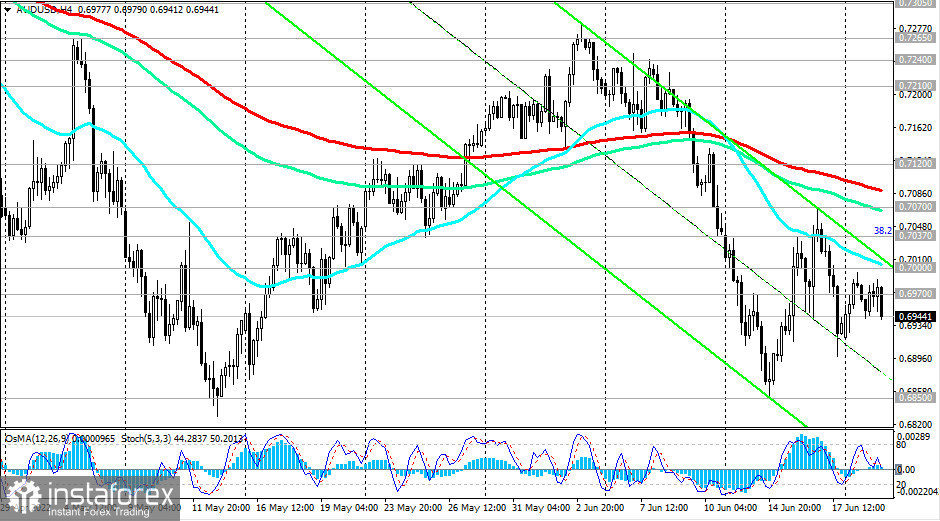
AUD remains under pressure, primarily against the US dollar. As of this writing, AUD/USD is trading near 0.6945, continuing to decline towards the lower border of the descending channel on the weekly chart, which is currently below 0.6800.
Given the Fed's propensity to pursue a tighter monetary policy and in anticipation of further strengthening of the US dollar, a deeper decline in AUD/USD should be expected.
A breakdown of local support levels 0.6850, 0.6800 will confirm our assumption, and AUD/USD will head towards multi-year lows reached in March 2020 near 0.5665, 0.5510 with intermediate targets at support levels 0.6500, 0.6455 (23.6% Fibonacci retracement to the wave of the pair's decline from 0.9500 in July 2014 to 2020 lows near 0.5510), 0.6270, 0.5975.
The continued positive upward trend in 10-year US bond yields makes the dollar an attractive asset for investment, given the prospects for further tightening of the Fed's monetary policy. The dollar is also actively used as a defensive asset, winning over traditional defensive assets such as gold, franc, and yen.
In an alternative scenario, AUD/USD will again try to break through the key resistance levels 0.7240 (200 EMA on the daily chart), 0.7210 (144 EMA on the daily chart), 0.7305 (200 EMA on the weekly chart, 50 EMA on the monthly chart). A breakdown of the resistance levels 0.7600 (200 EMA on the monthly chart), 0.7640 (144 EMA on the monthly chart) will bring AUD/USD into the zone of a long-term bull market.
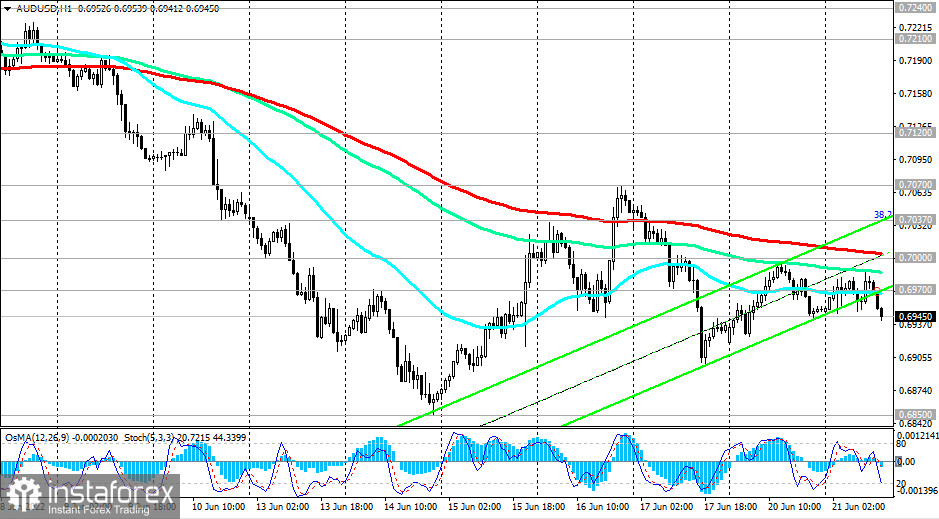
Support levels: 0.6900, 0.6850, 0.6800, 0.6455, 0.6270, 0.5975, 0.5665, 0.5510
Resistance levels: 0.6970, 0.7000, 0.7037, 0.7070, 0.7120, 0.7210, 0.7240, 0.7265, 0.7305
Trading Tips
Sell Stop 0.6915. Stop-Loss 0.7010. Take-Profit 0.6900, 0.6850, 0.6800, 0.6455, 0.6270, 0.5975, 0.5665, 0.5510
Buy Stop 0.7010. Stop-Loss 0.6915. Take-Profit 0.7037, 0.7070, 0.7120, 0.7210, 0.7240, 0.7265, 0.7305
*The market analysis posted here is meant to increase your awareness, but not to give instructions to make a trade.
InstaSpot analytical reviews will make you fully aware of market trends! Being an InstaSpot client, you are provided with a large number of free services for efficient trading.


