


فريقنا لديه أكثر من 7,000,000 من التجار!
كل يوم نعمل معا لتحسين التداول. نحصل على نتائج عالية ونمضي قدما.
الاعتراف من قبل الملايين من التجار في جميع أنحاء العالم هو أفضل تقدير لعملنا! لقد قمت باختيارك وسنفعل كل ما يلزم لتلبية توقعاتك!
نحن فريق رائع معا!
إنستافوركس تعتز بالعمل بالنسبة لك!


الممثل وبطل مسابقة يو إف سي 6 وبطل حقيقي!
الرجل الذي حقق النجاح بعمله الدؤوب. الرجل الذي يذهب كما نريد.
سر نجاح تاكتاروف هو حركة مستمرة نحو الهدف.
اكشف عن جميع جوانب موهبتك!
اكتشف، وحاول، وافشل - ولكن لا تتوقف أبدا!
إنستافوركس. تبدأ قصة نجاحك من هنا!
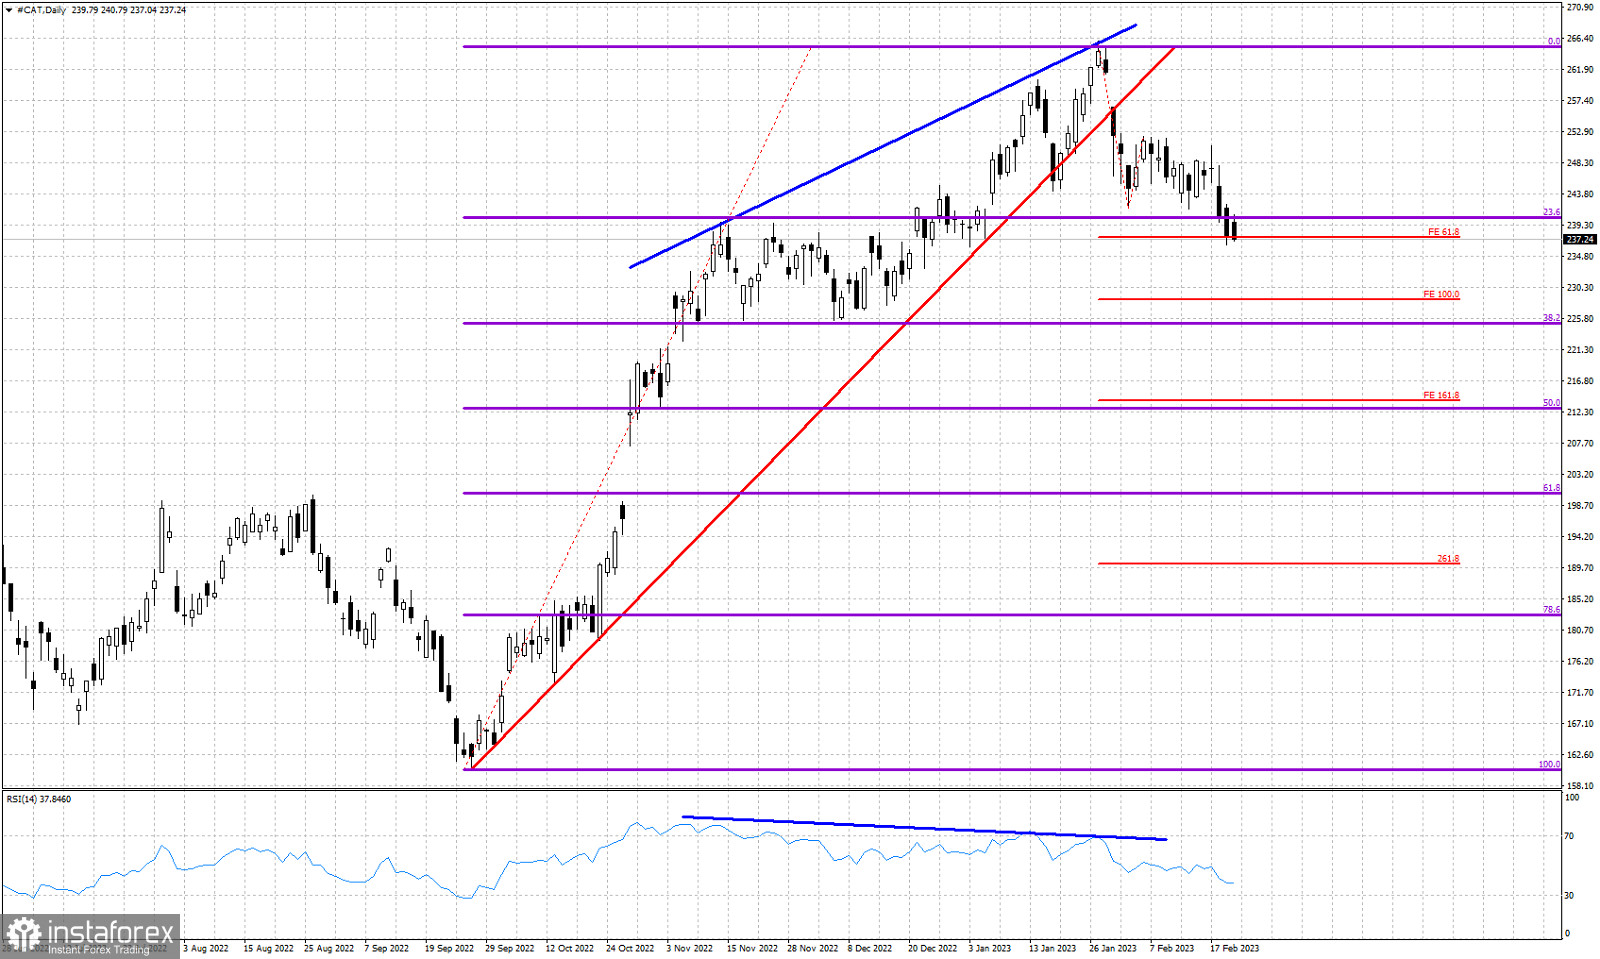
Blue lines- bearish RSI divergence
Red line- support trend line
Violet lines- Fibonacci retracement levels
Red horizontal lines- Fibonacci extension targets
Back in early February we warned traders regarding the vulnerability of the CAT stock and the bearish signal we got when price broke key short-term support. Back then we noted that a pull back towards $244 was expected and maybe lower towards $230. Price has now reached the first target and is showing potential for a move even lower. The RSI is far from oversold conditions. Price is making lower lows and lower highs. Short-term trend is bearish and we are in a pull back phase relative to the upward move that started back in September. Major support and major target remains the 38% Fibonacci level at $225.
*The market analysis posted here is meant to increase your awareness, but not to give instructions to make a trade.
InstaSpot analytical reviews will make you fully aware of market trends! Being an InstaSpot client, you are provided with a large number of free services for efficient trading.


