




فريقنا لديه أكثر من 7,000,000 من التجار!
كل يوم نعمل معا لتحسين التداول. نحصل على نتائج عالية ونمضي قدما.
الاعتراف من قبل الملايين من التجار في جميع أنحاء العالم هو أفضل تقدير لعملنا! لقد قمت باختيارك وسنفعل كل ما يلزم لتلبية توقعاتك!
نحن فريق رائع معا!
إنستافوركس تعتز بالعمل بالنسبة لك!





الممثل وبطل مسابقة يو إف سي 6 وبطل حقيقي!
الرجل الذي حقق النجاح بعمله الدؤوب. الرجل الذي يذهب كما نريد.
سر نجاح تاكتاروف هو حركة مستمرة نحو الهدف.
اكشف عن جميع جوانب موهبتك!
اكتشف، وحاول، وافشل - ولكن لا تتوقف أبدا!
إنستافوركس. تبدأ قصة نجاحك من هنا!
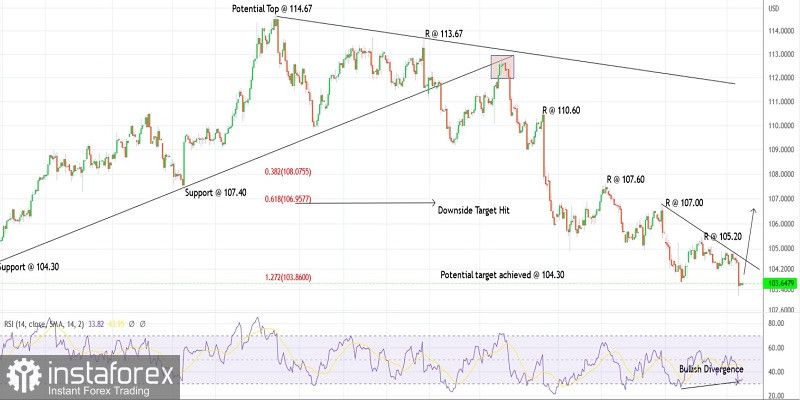
The US dollar index dropped through the 103.15 lows during the New York session on Tuesday before finding bids again. The index is seen to be trading around 103.65 at this point in writing as the bulls prepare to push higher from here. Immediate price resistance is at 105.20 as marked on the 4H chart here and a break there confirms the bottom is in place.
The US dollar index has further produced a bullish divergence on the 4H RSI as marked here. This could be seen as a potential trend reversal against the recent swing low at 103.15. We need to see a candlestick pattern formation here. The minimum requirement for a three-wave corrective decline from 114.70 has been fulfilled now.
If the above scenario is correct and holds well, a strong bullish reversal should be seen from current levels towards 110.00-50 at least. Short-term price support is just below 103.15, while resistance is 105.20. A break higher will add further confidence towards the bullish setup. Prices should be looking higher from current levels.
Potential bullish reversal against 102.00
Good luck!
*The market analysis posted here is meant to increase your awareness, but not to give instructions to make a trade.
InstaSpot analytical reviews will make you fully aware of market trends! Being an InstaSpot client, you are provided with a large number of free services for efficient trading.


