


الأسطورة فى فريق إنستافوركس!
الأسطورة! هل تعتقد أن هذا هو الخطاب المنمق؟ ولكن كيف ينبغي أن نطلق على الرجل، الذي أصبح أول آسيوي يفوز ببطولة العالم للشطرنج للشباب بعمر 18 سنة والذي أصبح أول أستاذ كبير هندي في سن 19؟ وكانت هذه بداية طريق صعب إلى لقب بطل العالم لـ فيسواناثان أناند، الرجل الذي أصبح جزءًا من تاريخ الشطرنج إلى الأبد. والآن أسطورة آخر في فريق إنستافوركس!


يعتبر بوروسيا دورتموند أحد أكثر أندية كرة القدم حصولاً على الألقاب في ألمانيا، وقد أثبت ذلك مرارًا وتكرارًا للجماهير: فإنّ روح المنافسة والقيادة ستؤدي بالتأكيد إلى النجاح. قم بالتداول بنفس الطريقة التي يلعب بها المحترفون الرياضيون اللعبة: بثقة ونشاط. احتفظ بـ "ترخيص دخول" من نادي بوروسيا دورتموند لكرة القدم وكن في الصدارة مع إنستافوركس!
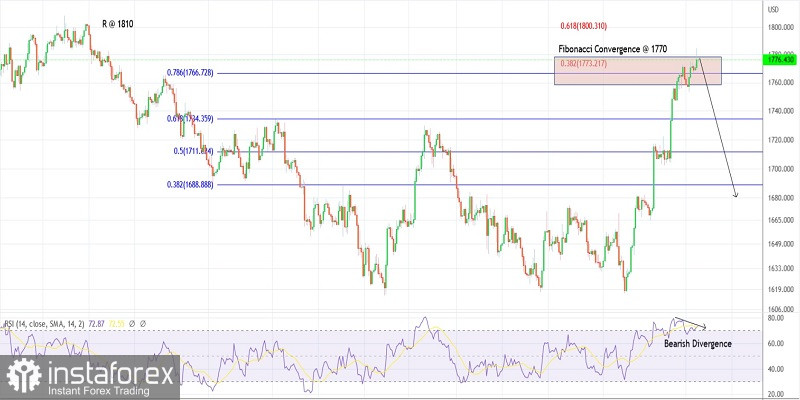
Gold prices rose through a fresh intraday high at $1,784-85 on Tuesday before pulling back. The yellow metal is seen to be trading close to $1,775 at this point in writing as the bears remain inclined to drag prices lower towards $1,747 at least. Please be aware that prices could test $1,807 to complete the expanded flat corrective structure, before turning lower again.
Gold prices have printed another high at the $1784-85 mark with a strong bearish divergence on the RSI as seen on the 4H chart here. Furthermore, prices are close enough to the Fibonacci convergence around the $1,770-75 zone discussed earlier. A high probability remains for a bearish reversal from here and a break below $1,747 will add further to our confidence.
On the flip side, if Gold prices sustain around current levels, it could open the door for gold to push through the $1,807-10 levels in the near term. The possibility also remains for a push through $1,820-30 before turning lower again. Looking at the larger wave structure, the metal is a good case to be sold on rallies from here on.
Potential bearish reversal against $1,830
Good luck!
*The market analysis posted here is meant to increase your awareness, but not to give instructions to make a trade.
InstaSpot analytical reviews will make you fully aware of market trends! Being an InstaSpot client, you are provided with a large number of free services for efficient trading.


